Guide Navigation
- Chapter 1: The Spectrophotometer: A Cornerstone of Modern Analytical Science
- Chapter 2: The Principles of Spectrophotometry: From Theory to Measurement
- Chapter 3: Exploring the Endless Possibilities: Applications of the Spectrophotometer
- Chapter 4: Best Practices for Accurate and Reliable Measurements
- Chapter 5: A Strategic Guide to Acquiring a Spectrophotometer
- Chapter 6: Comparative Analysis: Placing the Spectrophotometer in Context
- Chapter 7: Documentation (Manual & Video)
- Chapter 8: Conclusion: The Enduring Value of Spectrophotometry
Chapter 1: The Spectrophotometer: A Cornerstone of Modern Analytical Science
 |
 |
 |
 |
1.1 Defining the Spectrophotometer: More Than Just a Color Measurement Tool
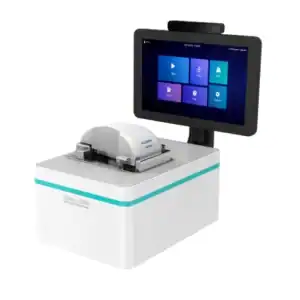
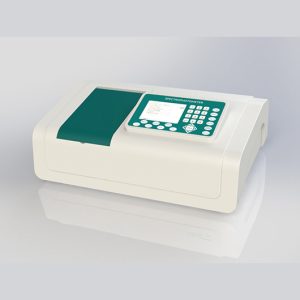
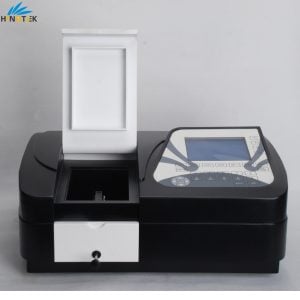
A spectrophotometer (View HINOTEK Spectrophotometer Category) is a fundamental analytical instrument used in laboratories and industries worldwide to measure the quantity of light that a sample absorbs or transmits. At its core, it operates by passing a controlled beam of light through a sample and detecting the intensity of that light before and after the interaction. The resulting difference in light intensity provides a precise measurement of the sample’s absorbance or transmittance properties at a specific wavelength.
While often associated with color analysis, the capabilities of a spectrophotometer extend far beyond simple colorimetry. It is a highly sophisticated device that enables both quantitative analysis (determining the concentration of a substance) and qualitative analysis (identifying a substance based on its unique absorption characteristics). This dual capability makes it an essential tool for analyzing a vast array of materials, from complex biological preparations like DNA and proteins to industrial chemicals, pharmaceuticals, and food products. The instrument’s output is typically a spectrum—a graphical representation of absorbance or transmittance plotted against wavelength—which serves as a unique spectral “fingerprint” for the substance under investigation.
1.2 Core Function: Quantifying the Interaction Between Light and Matter
The operation of a spectrophotometer is based on the fundamental interaction between electromagnetic radiation (light) and matter. When a beam of light passes through a sample, molecules within that sample absorb photons of specific energies, which correspond to specific wavelengths of light. This absorption excites the molecules to a higher energy state. The light that is not absorbed passes through the sample and is known as transmitted light.
The spectrophotometer meticulously quantifies this interaction. It generates light, isolates a specific wavelength, passes it through the sample, and measures the intensity of the transmitted light. By comparing the initial light intensity (I0) with the final transmitted intensity (I), the instrument calculates the sample’s absorbance. This measurement can reveal critical information about the substance’s concentration, purity, chemical structure, and other physical properties.
1.3 Why It’s Indispensable: The Role of Spectrophotometry Across Industries
The true value and indispensability of the spectrophotometer lie in its ability to translate a subjective physical property, such as color or turbidity, into an objective, reproducible numerical value. The human eye is an excellent tool for qualitative comparison, but it is inherently subjective and cannot assign a precise value to a color. A spectrophotometer removes this ambiguity, providing quantifiable data that is the bedrock of modern scientific research and industrial quality control. This objectivity allows for the creation of universal standards, manufacturing tolerances, and scientifically valid, repeatable experiments.
Because of this, spectrophotometry is a ubiquitous and versatile technique. Its applications span nearly every scientific and industrial sector:
- Pharmaceuticals: Used for drug discovery, development of formulations, stability testing, and rigorous quality control of both raw materials and finished products.
- Biochemistry and Life Sciences: Essential for quantifying nucleic acids (DNA/RNA) and proteins, studying enzyme kinetics, and monitoring cellular growth.
- Environmental Testing: Plays a crucial role in monitoring water and air quality by detecting and quantifying pollutants like heavy metals, nitrates, and harmful gases.
- Food and Beverage: Ensures color consistency, which consumers associate with flavor and quality, and quantifies key components like bitterness in beer or caffeine content.
- Materials Science: Characterizes the optical properties of materials, including plastics, textiles, and coatings, ensuring they meet design specifications.
The technique’s high sensitivity, accuracy, and non-destructive nature—meaning the sample can often be recovered unchanged after analysis—further solidify its status as an invaluable tool for research, development, and quality assurance across the globe.
Chapter 2: The Principles of Spectrophotometry: From Theory to Measurement
Understanding how a spectrophotometer works requires following the journey of light as it travels through the instrument’s components and examining the physical law that governs the measurement.
2.1 The Light Path: A Step-by-Step Journey Through the Instrument
A spectrophotometer is composed of several critical optical and electronic components working in concert. The process can be understood by tracing the path of light from its source to the final reading.
 |
|
-
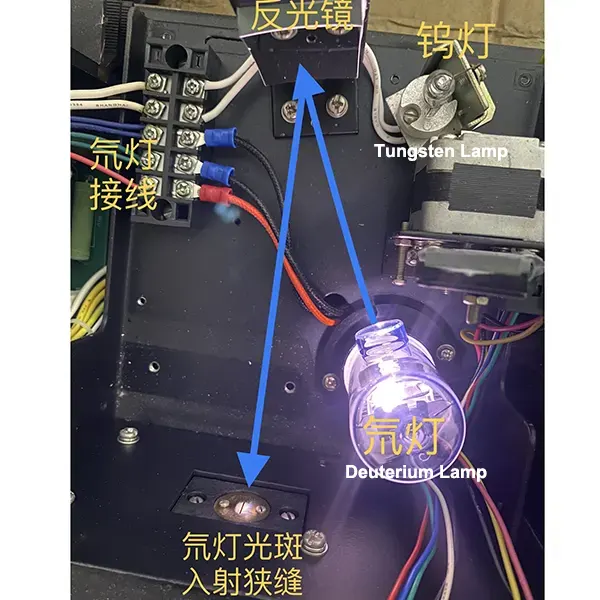
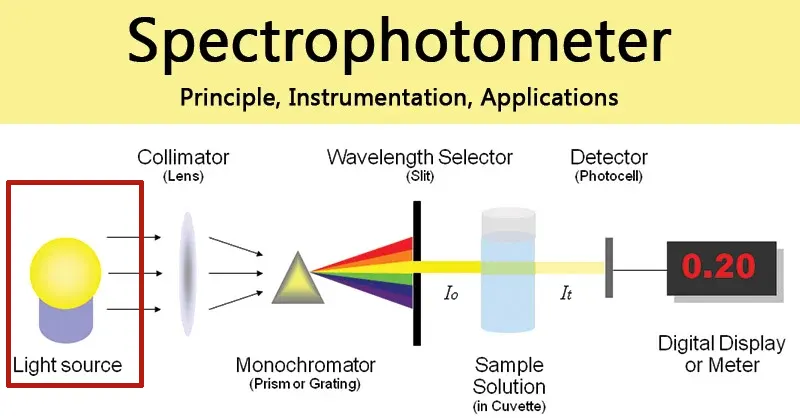
- The Light Source: The journey begins at the light source, which provides a stable and intense beam of electromagnetic radiation. The type of lamp used depends on the desired wavelength range. For measurements in the visible (VIS) spectrum (approximately 325–1100 nm), a tungsten-halogen lamp is typically used. For the ultraviolet (UV) spectrum (approximately 190–400 nm), a deuterium arc lamp is the standard choice. Many modern instruments contain both lamps to cover the full UV-Vis range.
Xenon flash lamps are another common alternative that offer a long lifespan and do not require warm-up time. But becasue high price, so normally only be used for high-end spectrophotometer and HINOTEK Micro Spectrophotometer.
- The Light Source: The journey begins at the light source, which provides a stable and intense beam of electromagnetic radiation. The type of lamp used depends on the desired wavelength range. For measurements in the visible (VIS) spectrum (approximately 325–1100 nm), a tungsten-halogen lamp is typically used. For the ultraviolet (UV) spectrum (approximately 190–400 nm), a deuterium arc lamp is the standard choice. Many modern instruments contain both lamps to cover the full UV-Vis range.
 |
|
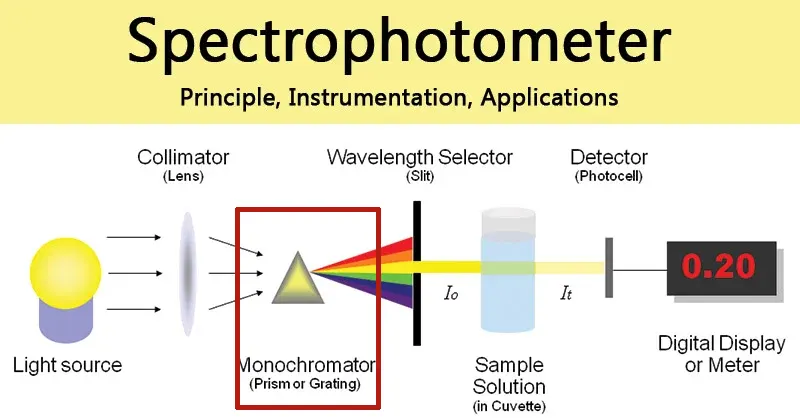
2. The Monochromator (Wavelength Selector): The “white” light from the source is a mixture of many wavelengths. The monochromator’s job is to isolate a very narrow band of these wavelengths. The light enters the monochromator through an entrance slit and is directed onto a dispersive element. In modern instruments, this is almost always a diffraction grating—a precisely ruled surface that separates the light into its constituent colors, much like a prism. By rotating the diffraction grating, a specific wavelength can be selected to pass through an exit slit, while all other wavelengths are blocked. The width of this exit slit helps determine the instrument’s spectral bandwidth and resolution.
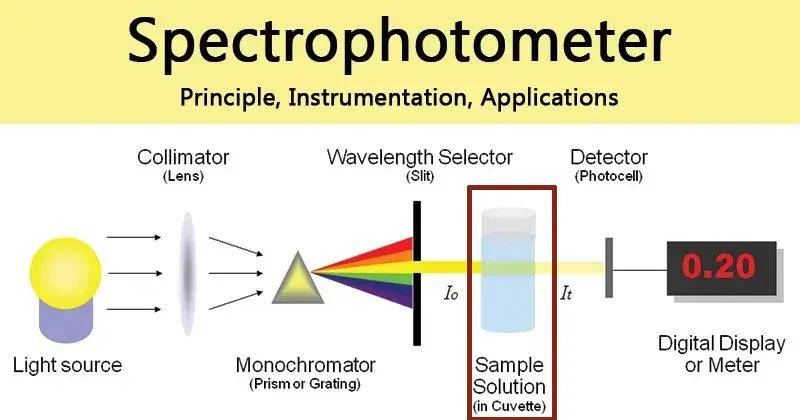 |
3. The Sample Chamber and Cuvette: The now-monochromatic light beam passes into the sample compartment, where it traverses the sample being analyzed. The sample is held in a cuvette, a small, rectangular vessel with optically transparent sides. The choice of cuvette material is critical: for measurements in the UV range,
quartz cuvettes are required because glass and plastic absorb UV light. For measurements confined to the visible range, less expensive glass or disposable plastic cuvettes are sufficient. The standard path length—the distance the light travels through the sample—is 1 cm.
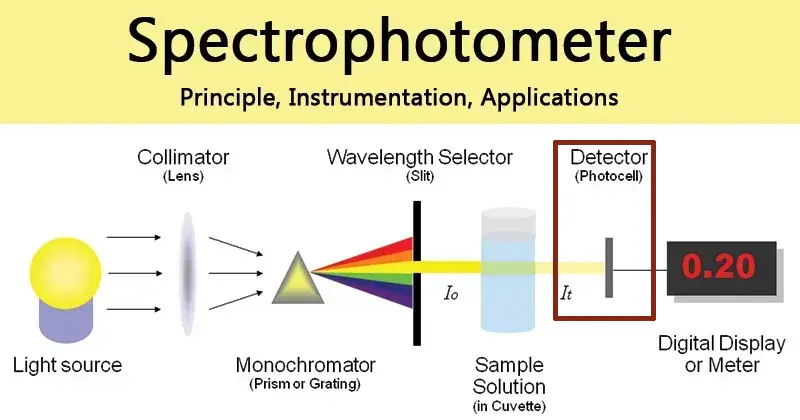 |
4. The Detector: After passing through the sample, the attenuated light beam strikes a detector. The detector’s function is to convert the light energy (photons) into a measurable electrical signal. Common types of detectors include
photodiodes and, for higher sensitivity, photomultiplier tubes (PMTs). The strength of the electrical signal is directly proportional to the intensity of the light reaching the detector. The instrument’s electronics then process this signal and display it as either percent transmittance (%T) or, more commonly, absorbance (A).
| Component | Function | Common Types |
| Light Source | Provides a stable, continuous source of radiation across the desired spectral range. | Tungsten-Halogen (Visible), Deuterium (UV), Xenon Flash (UV-Vis) |
| Monochromator | Selects a specific, narrow band of wavelengths from the light source. | Diffraction Grating, Prism |
| Sample Holder | Holds the sample in the light path with a fixed, known path length. | Cuvette (Quartz, Glass, Plastic) |
| Detector | Measures the intensity of transmitted light and converts it to an electrical signal. | Photodiode, Photomultiplier Tube (PMT) |
Interested in the double beam spectrophotometer? Visit our page: What is a Double Beam Spectrophotometer: Principles, Applications, and Performance
2.2 The Beer-Lambert Law: The Mathematical Heart of Spectrophotometry
The relationship between the measured absorbance and the concentration of the analyte is described by the Beer-Lambert Law, often simply called Beer’s Law. This principle is the mathematical foundation of quantitative spectrophotometry. It is expressed by the equation: A=ϵbc
Where:
- A is Absorbance: A dimensionless quantity that measures the amount of light absorbed by the sample. It is defined by a logarithmic relationship to transmittance (T), where T is the ratio of transmitted light intensity (I) to the incident light intensity (I0). The formulas are:
T=I0/I
A=−log10(T)=−log10(I0/I)
This logarithmic definition is crucial. While transmittance decreases exponentially with concentration, absorbance has a direct, linear relationship, which makes creating calibration curves and calculating unknown concentrations far simpler. - ϵ (epsilon) is the Molar Absorptivity: Also known as the molar extinction coefficient, this is a constant that is characteristic of a specific substance at a specific wavelength. It represents how strongly the substance absorbs light and has units of Liters per mole-centimeter (L⋅mol−1⋅cm−1). A high molar absorptivity means the substance is a strong absorber of light at that wavelength.
- b is the Path Length: This is the distance the light travels through the sample. In most standard spectrophotometers, this is determined by the width of the cuvette. Standard is 1 cm (Q-4 or G-4), HINOTEK provide various cell for your spectrophotometer.
- c is the Concentration: This is the concentration of the light-absorbing species in the solution, typically expressed in moles per liter (mol/L or M).
The power of the Beer-Lambert Law is its prediction of a linear relationship between absorbance and concentration. By preparing a series of standard solutions of known concentrations and measuring their absorbances, one can create a calibration curve. The absorbance of an unknown sample can then be measured, and its concentration can be accurately determined by interpolation from this curve.
2.3 Insight: Beyond the Ideal – Critical Limitations of the Beer-Lambert Law
While the Beer-Lambert Law is a powerful and elegant model, its linearity holds true only under specific, ideal conditions. In practice, deviations from this law are common and must be understood to ensure accurate analysis and to inform proper experimental design. These limitations are not mere theoretical footnotes; they are the direct drivers behind the established “best practices” in spectrophotometry. Understanding these deviations is what elevates a user from a technician to a scientist. The deviations can be broadly categorized into fundamental/chemical and instrumental limitations.
Fundamental and Chemical Deviations
These deviations arise from the chemical nature of the sample itself, especially as concentration changes.
- High Concentrations: The Beer-Lambert Law is fundamentally a “limiting law,” meaning it is most accurate at low concentrations (typically < 0.01 M). At higher concentrations, several effects cause the linear relationship to fail:
- Intermolecular Interactions: Analyte molecules become so close to each other that they begin to interact, altering their electronic charge distribution. This can change the molar absorptivity (ϵ), leading to a non-linear plot.
- Refractive Index Changes: The refractive index of a solution can change significantly at high solute concentrations. Since molar absorptivity is dependent on the refractive index, this also contributes to deviations.
- Practical Consequence: This is why a standard best practice is to dilute samples so their absorbance falls within the known linear range of the instrument and the assay.
- Chemical Equilibria: Deviations arise if the absorbing species is involved in a chemical equilibrium, such as association, dissociation, or reaction with the solvent. For example, an acid-base indicator exists as two species (e.g., HIn and In⁻) in equilibrium. Each species has its own unique molar absorptivity. If the pH of the solution is not controlled, the ratio of the two species will change with concentration, violating the assumption of a single, constant
ϵ and causing a non-linear Beer’s Law plot.
- Practical Consequence: This is why it is critical to use a buffer to maintain a constant pH for both the standards and the samples when working with pH-sensitive compounds, ensuring that the proportion of each absorbing species remains constant.
Instrumental Deviations
These deviations are caused by imperfections in the instrument itself.
- Polychromatic Radiation: The Beer-Lambert Law is derived assuming the use of perfectly monochromatic light (a single wavelength). However, all monochromators pass a small range of wavelengths known as the spectral bandpass. If the molar absorptivity (ϵ) of the analyte changes significantly across this bandpass, deviations from linearity will occur. This effect is most pronounced on the steep sides of an absorption peak.
- Practical Consequence: This is why the standard procedure is to perform measurements at the wavelength of maximum absorbance (λmax). At the peak of the absorption band, the curve is relatively flat, meaning ϵ changes very little across the instrument’s bandpass, thus minimizing the deviation.
- Stray Light: This is any unwanted radiation that reaches the detector without having passed through the sample correctly. It can arise from scattering within the instrument or from imperfections in the optics. Stray light becomes a major problem at high absorbance values. When a sample has high absorbance, the intensity of the transmitted light (I) becomes very low. If this low intensity is comparable to the intensity of the stray light, the detector measures an artificially high total light level. This leads to a calculated absorbance that is lower than the true value, causing the calibration curve to bend downwards and plateau at high concentrations.
- Practical Consequence: This is another reason to work within a defined absorbance range (often 0.1 to 1.0 A) and to avoid highly concentrated samples that produce absorbances where stray light effects become significant.
To delve deeper into the foundational principles of spectrophotometry, you can explore our detailed guides on page: An In-Depth Analysis of the Beer-Lambert Law Spectrophotometer: Theory, Application, and Limitations in Modern Spectrophotometry.
Chapter 3:Exploring the Endless Possibilities: Applications of the Spectrophotometer
The versatility, precision, and non-destructive nature of spectrophotometry have made it an indispensable analytical technique in a vast range of scientific and industrial fields. Its ability to provide rapid, reliable quantitative and qualitative data supports everything from fundamental research to industrial quality control.
3.1 A Versatile Tool for Diverse Fields
The applications of spectrophotometry are nearly limitless, touching almost every aspect of modern analysis:
- Chemical and Pharmaceutical Industries: Spectrophotometers are workhorses in these sectors. They are used for the quantitative analysis of active pharmaceutical ingredients (APIs), monitoring the progress of chemical reactions (kinetics), ensuring the purity of raw materials, and performing final quality control on drugs and chemical products.
- Environmental Science: In environmental monitoring, the technique is critical for assessing the health of our ecosystems. It is used to measure the concentration of pollutants like nitrates, phosphates, and heavy metals in water samples, and to analyze atmospheric pollutants such as sulfur dioxide and nitrogen oxides in the air.
- Food & Beverage Industry: Spectrophotometry helps ensure the quality and consistency of food products. It is widely used for color analysis, which consumers link to freshness and flavor. Specific applications include measuring International Bitterness Units (IBUs) in beer, determining the concentration of caffeine in beverages, and verifying the vitamin content of fortified foods.
- Clinical Diagnostics: In medical laboratories, spectrophotometric assays are fundamental to diagnosing and monitoring diseases. By analyzing biological samples like blood and urine, clinicians can measure the concentration of critical biomarkers, such as glucose, cholesterol, and various enzymes, to assess a patient’s health.
- Materials Science and Manufacturing: The technique is used to characterize the optical properties of materials like plastics, textiles, and glass, ensuring color consistency and product quality. It is also used in the analysis of coatings and thin films in the semiconductor industry.
3.2 Focus on Life Sciences: DNA, RNA, and Protein Quantification
One of the most common and vital applications of UV-Vis spectrophotometry is in molecular biology for the quantification and purity assessment of nucleic acids and proteins. This process is fundamental to countless downstream applications, including PCR, sequencing, and cloning.
The Principle of A260/A280 Measurement
The method relies on the fact that different biological macromolecules have characteristic absorbance peaks at specific UV wavelengths.
- Nucleic Acids (DNA and RNA) have a strong absorbance maximum at a wavelength of 260 nm due to the aromatic ring structures of the purine and pyrimidine bases.
- Proteins have an absorbance maximum at 280 nm, primarily due to the aromatic amino acids tryptophan and tyrosine.
By measuring the absorbance at these key wavelengths, a researcher can both determine the concentration of the molecule of interest and assess the purity of the sample.
Quantification and Purity Assessment
- Quantification: The concentration of a nucleic acid sample is calculated directly from its absorbance at 260 nm (A260). The Beer-Lambert law is applied using established conversion factors. For example:
- An A260 of 1.0 corresponds to approximately 50 µg/mL of double-stranded DNA (dsDNA).
- An A260 of 1.0 corresponds to approximately 40 µg/mL of single-stranded RNA (ssRNA).
- An A260 of 1.0 corresponds to approximately 33 µg/mL of single-stranded DNA (ssDNA).
- Purity Assessment via the A260/A280 Ratio: This ratio is the primary indicator of nucleic acid purity, specifically checking for protein contamination.
- A ratio of ~1.8 is generally accepted as “pure” for DNA.
- A ratio of ~2.0 is considered “pure” for RNA.
- A ratio significantly lower than 1.8 indicates the presence of contaminating protein or residual phenol from the extraction process, as these absorb strongly at 280 nm.
- Purity Assessment via the A260/A230 Ratio: This secondary ratio is crucial for detecting contamination from common reagents used during nucleic acid purification.
- An acceptable A260/A230 ratio for pure samples is typically in the range of 2.0 to 2.2.
- A low A260/A230 ratio suggests the presence of contaminants that absorb at 230 nm, such as phenol, EDTA, carbohydrates, or guanidine salts (often used in purification kits).
- Other Contamination Indicators:
- Absorbance at 325-340 nm indicates turbidity, air bubbles, or contamination from particulates in the solution, suggesting the sample is not properly dissolved or the cuvette is dirty.
- The pH and ionic strength of the solution used to resuspend the nucleic acid can also influence the absorbance ratios, so it is important to use a consistent, low-salt buffer (like TE buffer) for both the blank and the sample measurements.
| Ratio | Pure DNA | Pure RNA | Indication of Low Ratio | Indication of High Ratio |
| A260/A280 | ~1.8 | ~2.0 | Protein or phenol contamination | May indicate RNA contamination in DNA sample |
| A260/A230 | 2.0 – 2.2 | 2.0 – 2.2 | Contamination with salts (guanidine), carbohydrates, or phenol | Generally not an issue; a clean baseline is key |
For a comprehensive walkthrough of this essential laboratory procedure, please see our detailed guide on How to Use a Spectrophotometer for DNA and Protein Quantification (A260/A280) .
If you want to determin Caffeine in Beverages by Spectrophotometer, please review page: Determination of Caffeine in Beverages by Spectrophotometer.
Measuring the concentration of Staphylococcus aureus bacterial suspension using spectrophotometry.
Chapter 4: Best Practices for Accurate and Reliable Measurements
A spectrophotometer is a powerful instrument, but the quality of the data it produces is entirely dependent on the quality of the procedures used to operate it. Adhering to established best practices for sample preparation, instrument calibration, and routine maintenance is non-negotiable for generating accurate, reliable, and reproducible results. As established previously, these practices are not arbitrary; they are direct solutions to the inherent chemical and instrumental limitations of the measurement technique.
4.1 The Foundation of Quality Data: Proper Sample and Cuvette Handling
The principle of “garbage in, garbage out” applies perfectly to spectrophotometry. No amount of instrumental sophistication can compensate for a poorly prepared sample.
Sample Preparation
- Homogeneity: Ensure that the sample is thoroughly mixed and homogenous before taking an aliquot for measurement. Inconsistent sampling will lead to inconsistent results.
- Dilution: As discussed, the Beer-Lambert Law is only linear over a specific concentration range. Highly concentrated samples must be carefully diluted to bring their absorbance into the instrument’s optimal linear range (typically 0.1 to 1.0 A).
- Clarity: Samples must be free of particulates, precipitates, or bubbles, as these will scatter light and cause erroneously high absorbance readings. If necessary, filter or centrifuge the sample to remove suspended solids.
- Blanking Buffer: The “blank” solution must be the exact same buffer or solvent that the sample is dissolved in. This ensures that any absorbance from the buffer components is subtracted, isolating the absorbance of the analyte of interest.
Cuvette Handling
The cuvette is a critical optical component and must be treated with care.
- Material Selection: Use the correct cuvette for the wavelength range. Quartz cuvettes are mandatory for UV measurements (< 340 nm), while less expensive glass or plastic cuvettes are suitable for the visible range.
- Cleaning: Cuvettes must be scrupulously clean. Any smudges, fingerprints, or residue on the optical surfaces will absorb or scatter light, leading to inaccurate readings. Always handle cuvettes by their frosted or opaque sides. Clean them with a suitable solvent and wipe the clear optical faces with a lint-free laboratory wipe before each measurement.
- Orientation: Always place the cuvette in the sample holder in the same orientation for every measurement (blank and samples). Minor imperfections in the cuvette walls can cause slight variations in absorbance, and consistent orientation minimizes this error.
- Avoid Bubbles: When pipetting the sample into the cuvette, avoid introducing air bubbles. Bubbles in the light path will cause significant light scattering and invalidate the reading.
4.2 Instrument Calibration: Ensuring Precision and Accuracy
Calibration is the process of verifying that the instrument is performing to its specifications. This involves two key steps: routine blanking and periodic performance verification with certified standards.
- The “Blank” Measurement: Before measuring any samples, the instrument must be “blanked” or “zeroed.” This involves placing a cuvette containing the blank solution (the solvent/buffer without the analyte) into the spectrophotometer and setting the absorbance to 0.000 at the desired wavelength. This critical step subtracts the background absorbance of the cuvette and the solvent, ensuring that any subsequent reading is due solely to the analyte. This procedure must be repeated whenever the wavelength is changed.
- Performance Verification with Certified Reference Materials (CRMs): For laboratories operating under regulatory compliance (e.g., GLP/GMP) or requiring the highest level of accuracy, periodic calibration using traceable standards is essential. This verifies three key performance parameters:
- Wavelength Accuracy: This ensures that the wavelength selected by the monochromator is the actual wavelength passing through the sample. It is checked using materials with sharp, well-characterized absorbance peaks, such as a holmium oxide solution or glass filter, or a didymium filter.
- Photometric Accuracy: This verifies that the measured absorbance value is correct. It is tested using standards with known, certified absorbance values at specific wavelengths. The most common standard for the UV range is an acidified potassium dichromate solution. For the visible range, neutral density glass filters are used.
- Stray Light: This measures the level of stray radiation in the instrument, which can be checked with specific cutoff filters or solutions like sodium iodide or potassium chloride.
| Calibration Standard | Purpose | Key Wavelengths (nm) |
| Holmium Oxide (Solution or Glass) | Wavelength Accuracy | 241, 287, 361, 451, 536, 640 |
| Potassium Dichromate (Acidified Solution) | Photometric Accuracy & Linearity (UV) | 235, 257, 313, 350 |
| Neutral Density Glass Filters | Photometric Accuracy (Visible) | 440, 465, 546, 590, 635 |
| Toluene in Hexane | Spectral Resolution | Ratio of absorbance at 269 nm (max) vs. 266 nm (min) |
| Potassium Chloride / Sodium Iodide | Stray Light | Cutoff measurements near 198 nm (KCl) or 220 nm (NaI) |
A well-maintained instrument is a reliable instrument. Simple, routine checks can prevent many common problems.
- Routine Maintenance:
- Warm-up Time: Allow the instrument’s lamps to warm up and stabilize before use, as recommended by the manufacturer (often 15-30 minutes for deuterium/tungsten lamps). This minimizes drift in readings.
- Cleaning: Keep the instrument’s exterior and sample compartment clean and free of dust and spills.
- Lamp Inspection: Periodically check lamp performance. Aging lamps are a common source of increased noise and instability.
- Troubleshooting Common Issues:
- Noisy or Fluctuating Readings: This can be caused by an aging lamp, electrical interference, bubbles in the sample, or sample degradation during measurement. Check the lamp, ensure a stable power source, and re-prepare the sample carefully.
- Drifting Readings: Often caused by insufficient warm-up time or significant temperature fluctuations in the laboratory. Ensure the instrument is fully stabilized before starting measurements.
- Inaccurate or Irreproducible Results: This is most frequently caused by user error. Re-check the entire process: Was the correct blank used? Were the cuvettes clean and handled properly? Was the sample diluted correctly? Is the wavelength set correctly?. If user error is ruled out, the issue may be dirty optics or a need for recalibration.
For more detailed guidance on resolving instrument issues and performing calibrations, you can first refer to our article:
- 1: Spectrophotometer Troubleshooting
- 2: 20 Common Problems and Solutions for UV-Vis Spectrophotometers
- 3: Mastering Your Spectrophotometer: A Step-by-Step Guide to Warm-up, Calibration, and Cleaning.
Chapter 5: A Strategic Guide to Acquiring a Spectrophotometer
Selecting the right spectrophotometer is a critical decision that can impact a laboratory’s efficiency, accuracy, and budget for years to come. It is not merely a hardware purchase but a strategic investment that must align with the lab’s scientific applications, regulatory requirements, and operational workflow. A cheap instrument might be perfect for a teaching lab but could be a costly and non-compliant disaster for a pharmaceutical facility. This choice, therefore, reflects the lab’s entire philosophy on data quality and financial planning.
5.1 Key Factors to Consider Before Purchase
Before evaluating specific models, a lab manager or procurement specialist must first define the lab’s needs based on several key performance criteria:
- Wavelength Range: What part of the electromagnetic spectrum needs to be measured?
- UV-Vis (190-1000 nm): The most common range, suitable for nucleic acids, proteins, and a wide variety of chemical analyses. → Explore our UV-Vis Spectrophotomter Solutions.
- Visible (Vis) only (~325-1000 nm): A more budget-friendly option sufficient for colorimetric assays and color matching. → View the right Visible Spectrophotometer for your application
- UV-Vis-NIR (up to 3300 nm): Required for specialized materials science, telecommunications, and agricultural applications. → Explore our Infrared Spectrophotometer & NIR Spectrophotometer.
- Resolution and Sensitivity: How demanding are the measurements?
- Resolution is the ability to distinguish between two closely spaced absorbance peaks. High resolution is needed for analyzing complex mixtures with overlapping spectra.
- Sensitivity is the ability to detect low concentrations of an analyte. This is critical for trace analysis and is influenced by the instrument’s optics and detector quality.
- Beam Configuration:
- Single-Beam: More affordable and simpler, but requires separate blank and sample measurements. Suitable for basic QC and teaching labs where long-term stability is less critical.
- Double-Beam: Measures the sample and reference simultaneously, providing excellent stability by correcting for lamp drift in real-time. Essential for kinetics, long-term measurements, and high-precision R&D applications.→ Browse our full line of Double Beam Spectrophotomter.
- Sample Type and Throughput: How will samples be analyzed?
- Standard Cuvettes: The classic format for single-sample analysis.
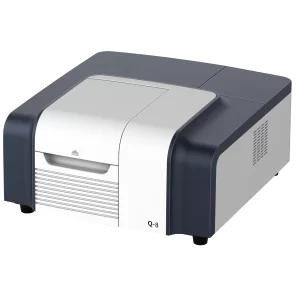
- Microvolume: Instruments like the Thermo Scientific NanoDrop are designed to measure 1-2 µL droplets of sample, conserving precious material. Ideal for DNA, RNA, and protein labs. HINOTEK also provide similar type Micro Spectrophotometer.
- Microplate Reader: For high-throughput screening, instruments that can read samples in 96- or 384-well plates are necessary.
- When your needs go beyond simple, routine concentration measurements and enter the realm of analysis requiring high sensitivity, selectivity, and rich information, it is the perfect time to choose a fluorescence spectrophotometer. HINOTEK provides high-quality Fluorescence spectrophotometers to meet these advanced demands.”
5.2 The Critical Role of Software
In a modern laboratory, the instrument’s software is as important as its hardware. It dictates the user experience, data integrity, and workflow integration.
- Data Analysis and Workflow Features: Look for software with intuitive controls, pre-programmed methods for common assays (e.g., Bradford, Lowry, DNA quantification), and advanced capabilities for kinetics or spectral scanning. Integration with a Laboratory Information Management System (LIMS) can be crucial for streamlining data handling in larger organizations.
- Navigating Regulatory Compliance: Understanding 21 CFR Part 11
For any laboratory operating in a regulated environment, such as pharmaceutical or biotech companies subject to FDA oversight, compliance with Title 21 of the Code of Federal Regulations (CFR) Part 11 is non-negotiable. This regulation governs the use of electronic records and electronic signatures, ensuring they are as trustworthy and reliable as paper records. Purchasing an instrument with 21 CFR Part 11-compliant software is a mandatory requirement. Key features of compliant software include:
- Access Control: Each user must have a unique, password-protected login. The system must allow administrators to define user roles and permissions, restricting access to certain functions based on the user’s responsibilities.
- Secure Audit Trails: The software must automatically generate a secure, time-stamped audit trail that logs every action performed on an electronic record (e.g., creation, modification, deletion). This log must be unalterable and must not obscure the original data.
- Electronic Signatures: The system must support the use of legally binding electronic signatures that are permanently linked to their respective records. These signatures must include the printed name of the signer, the date and time of signing, and the meaning of the signature (e.g., “reviewed,” “approved”).
- Data Integrity and Security: All electronic records must be protected from intentional or accidental alteration or deletion. The software must be able to detect any tampering with a signed record.
5.3 Beyond the Sticker Price: Total Cost of Ownership (TCO)
A comprehensive budget analysis must look beyond the initial purchase price and consider the long-term total cost of ownership.
- Initial Investment: Spectrophotometer prices vary widely.
- Ongoing Costs:
- Consumables: These are significant recurring expenses. Lamps have a finite lifespan (e.g., tungsten lamps ~2,000 hours, deuterium lamps ~1,000 hours) and can be costly to replace. The choice between disposable plastic cuvettes (cheap, for visible range) and reusable quartz cuvettes (expensive, for UV range) also impacts the long-term budget.
- Maintenance and Service Contracts: Annual preventative maintenance and calibration services are crucial for maintaining instrument accuracy and compliance. A service contract can provide peace of mind by covering unexpected repairs and minimizing costly downtime. These contracts typically cost a percentage of the instrument’s purchase price per year but can save thousands in the long run.
To make an informed decision based on your lab’s specific financial and technical needs, consult our detailed guide on: Spectrophotometer Price-How to choose a suitable spectrophotometer based on your budget .
Chapter 6: Comparative Analysis: Placing the Spectrophotometer in Context
The world of spectroscopy is filled with instruments whose names and functions can seem similar. To make an informed choice, it is essential to understand the key differences between a spectrophotometer and other related technologies.
6.1 Spectrophotometer vs. Spectrometer
Though often used interchangeably, these terms have distinct meanings. The key difference lies in their scope and composition.
- Spectrometer: This is a broad, general term for any instrument that measures a physical characteristic as a function of a spectrum. This is not limited to light; examples include mass spectrometers (measuring mass-to-charge ratio) and Nuclear Magnetic Resonance (NMR) spectrometers (measuring radiofrequency absorption). An optical spectrometer is a component that specifically measures the intensity of light across a range of wavelengths, typically consisting of an entrance slit, a dispersive element (grating), and a detector array. It is often a modular component integrated into a larger experimental setup.
- Spectrophotometer: This is a specific type of optical spectrometer. It is a complete, self-contained instrument that includes a light source, a monochromator, a sample holder, and a detector, all integrated into a single unit designed specifically to measure the absorbance or transmittance of light by a sample.
In short, all spectrophotometers are spectrometers, but not all spectrometers are spectrophotometers. If the goal is to analyze the properties of a light source itself, an optical spectrometer is used. If the goal is to use light to analyze a chemical or biological sample, a spectrophotometer is the appropriate instrument.
| Feature | Spectrometer | Spectrophotometer |
| Definition | General term for a device that measures a characteristic across a spectrum (e.g., light, mass). | A specific type of spectrometer that measures light absorbance/transmittance of a sample. |
| Composition | Often a modular component (e.g., grating and detector array) for integration. | A complete, integrated instrument with a light source, monochromator, sample holder, and detector. |
| Primary Function | Measures the spectral distribution of a source (e.g., emission spectrum of a lamp). | Measures how a sample interacts with light to determine concentration or purity. |
| Typical Application | Physics, optical engineering, analysis of light sources. | Analytical chemistry, biochemistry, quality control, clinical diagnostics. |
6.2 Fluorescence Spectrophotometer vs. UV-Visible Spectrophotometer
Both instruments analyze samples using light, but they measure fundamentally different phenomena.
- UV-Visible Spectrophotometer: This instrument measures light absorption. It quantifies how much of the incident light is absorbed as it passes directly through the sample. The detector is positioned in a direct line (180°) with the light source and the sample. It is a versatile technique applicable to any molecule with a chromophore (a light-absorbing group) but is generally less sensitive.
- Fluorescence Spectrophotometer (Fluorometer): This instrument measures light emission. It excites the sample with light of a specific wavelength, causing fluorescent molecules (fluorophores) to absorb that energy and then emit light at a longer, lower-energy wavelength. The detector is placed at a 90-degree angle to the excitation light source to avoid detecting the intense excitation light, measuring only the weaker emitted fluorescence. This technique is extremely sensitive—often 10 to 1,000 times more sensitive than absorbance—but is limited to samples that are naturally fluorescent or have been tagged with a fluorescent dye.
| Feature | UV-Visible Spectrophotometer | Fluorescence Spectrophotometer |
| Phenomenon Measured | Light Absorption | Light Emission (Fluorescence) |
| Detector Position | In-line (180°) with the light source | Perpendicular (90°) to the light source |
| Sensitivity | Moderate (micromolar range) | Extremely High (nanomolar to picomolar range) |
| Applicability | Broad: any absorbing molecule (chromophore) | Specific: only fluorescent molecules (fluorophores) or tagged molecules |
| Key Limitation | Lower sensitivity, affected by sample turbidity. | Susceptible to quenching and background fluorescence; requires fluorescent samples. |
6.3 Colorimeter vs. Spectrophotometer
These instruments are both used for color measurement, but they differ greatly in complexity and the type of data they provide.
- Colorimeter: A simpler, more portable, and less expensive device that quantifies color by mimicking human vision. It uses a fixed light source and a set of three filters (red, green, and blue) to measure the tristimulus values (RGB) of a sample. It provides a numerical representation of a color but does not provide detailed spectral information. Its primary limitation is its inability to detect
metamerism, a phenomenon where two colors appear to match under one lighting condition but not another. - Spectrophotometer: A far more sophisticated instrument that measures the reflectance or transmittance of a sample across the full visible spectrum (and often into the UV and NIR ranges) at many discrete wavelengths. It generates a detailed spectral reflectance curve, which is the sample’s true color “fingerprint.” This allows for highly accurate color measurement, color formulation, and the detection of metamerism. While more expensive, its precision is essential for R&D and stringent quality control.
| Feature | Colorimeter | Spectrophotometer |
| Principle | Measures tristimulus values (RGB) to mimic human vision. | Measures reflectance/transmittance across the full spectrum. |
| Wavelength Selector | Fixed Red, Green, Blue Filters | Monochromator (Diffraction Grating) |
| Data Output | A single set of color coordinates (e.g., RGB, CIELAB). | A complete spectral data curve. |
| Accuracy | Lower; cannot detect metamerism. | High; the most accurate method for color measurement and formulation; detects metamerism. |
| Cost & Portability | Less expensive, often portable. | More expensive, often benchtop (though portable models exist). |
| Typical Use | Basic color difference QC, field measurements. | R&D, color formulation, high-level QC, setting color standards. |
6.4 Double Beam vs. Single Beam Spectrophotometer
This is a key distinction in instrument design that directly impacts stability, accuracy, and cost.
- Single-Beam Spectrophotometer: This design uses a single light path. To make a measurement, the user must first measure a reference (blank) to set the 100% T / 0 A baseline. Then, the blank is removed, the sample is inserted, and its absorbance is measured. This sequential process makes the instrument susceptible to drift caused by fluctuations in the lamp’s intensity over time. They are, however, simpler in design and more cost-effective.
- Double-Beam Spectrophotometer: This design splits the light from the monochromator into two separate beams. One beam passes through the sample, while the other simultaneously passes through a reference. The instrument’s electronics continuously compare the intensity of the two beams, calculating a ratio. This design automatically and in real-time compensates for any fluctuations in lamp intensity or detector response, resulting in a much more stable baseline and higher accuracy. This stability is essential for applications that require long measurement times, such as kinetic studies, or for high-precision quantitative analysis.
| Feature | Single-Beam Spectrophotometer | Double-Beam Spectrophotometer |
| Light Path | One beam; measures reference and sample sequentially. | Two beams; measures reference and sample simultaneously. |
| Stability | Lower; susceptible to drift from lamp fluctuations over time. | High; automatically compensates for drift, providing a stable baseline. |
| Typical Applications | Basic quantitative analysis, endpoint assays, teaching labs. | Kinetic studies, wavelength scanning, high-precision research, regulated QC. |
| Cost & Complexity | Simpler, more affordable. | More complex, more expensive. |
| Throughput | Slower due to sequential measurements. | Faster, as reference and sample are read at the same time. |
To learn more about how these instruments stack up for specific needs, explore our detailed comparison guides:
1: Fluorescence Spectrophotometer vs. UV-Visible Spectrophotometer
2: Spectrophotometer Vs Spectrometer
3: Colorimeter VS Spectrophotometer
4: Double Beam Spectrophotometer Vs Single Beam Spectrophotometer
Chapter 7: Documentation
Here, we provide the user manual and operation video for a typical spectrophotometer (our N4S spectrophotometer). The operation of most spectrophotometers can be referenced using this manual and video.
N4S UV Visible Spectrophotometer Operation Manual.
N4S UV Visible Spectrophotometer Operation Video:
Chapter 8: Conclusion: The Enduring Value of Spectrophotometry
The spectrophotometer stands as a testament to the power of harnessing light for analytical purposes. From its foundational definition as an instrument that measures light absorption to its complex applications in regulated pharmaceutical laboratories, it has proven to be one of the most versatile, reliable, and indispensable tools in the modern scientific arsenal.
This guide has journeyed through the core principles of its operation, tracing the path of light through its intricate components and exploring the elegant mathematics of the Beer-Lambert Law. Critically, we have also illuminated the limitations of this law, demonstrating that a true understanding of the instrument comes not just from knowing how it works, but from knowing when and why it might fail to provide accurate results. This deeper knowledge transforms best practices from a set of arbitrary rules into a logical framework for designing robust, valid experiments.
Whether quantifying the concentration of a life-saving drug, assessing the purity of a DNA sample for genomic research, ensuring the color consistency of a consumer product, or monitoring the health of our environment, the spectrophotometer provides the objective, quantitative data that drives discovery, ensures quality, and enables innovation. The selection of such an instrument is a strategic decision, reflecting a laboratory’s commitment to accuracy, efficiency, and data integrity. As technology continues to evolve, the fundamental value of spectrophotometry—its ability to translate the subtle interactions of light and matter into meaningful, actionable information—will ensure its place as a cornerstone of science and industry for decades to come.
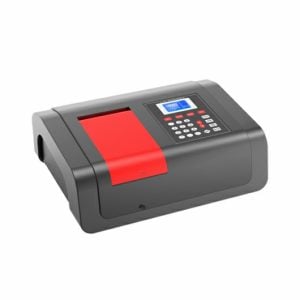
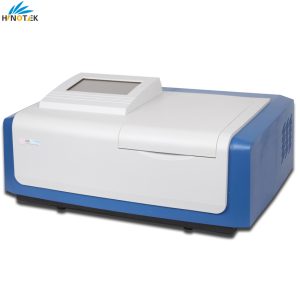
Below is a selection of HINOTEK’s featured Spectrophotometer. To see our full range, please visit HINOTEK main HINOTEK Spectrophotometer Category Page.


References
- Banwell, C., & McCash, E. (1994). Fundamentals of Molecular Spectroscopy (4th ed.). McGraw-Hill Higher Education.
- Barrow, G. M. (1962). Introduction to Molecular Spectroscopy. McGraw-Hill Book Co., Inc.
- Bethune, D. S., Meijer, G., Tang, W. C., Rosen, H. J., Golden, W. G., Seki, H., Brown, C. A., & de Vries, M. S. (1991). Vibrational Raman and infrared spectra of chromatographically separated C60 and C70 fullerene clusters. Chemical Physics Letters, 179, 181–186.
- Brand, J.C.D., & Speakman, J. C. (1975). Molecular Structure: The Physical Approach. Hodder & Stoughton Educational.
- Chang, R. (1970). Basic Principles of Spectroscopy. McGraw-Hill Book Co., Inc.
- Cotton, F. A. (1990). Chemical Applications of Group Theory (3rd ed.). Wiley Interscience.
- Hollas, J. M. (2003). Modern Spectroscopy (4th ed.). Wiley-Blackwell.
- Ladd, M. (1998). Symmetry and Group Theory in Chemistry. Horwood Publishing
Works cited:
1. Spectrophotometry – Wikipedia, https://en.wikipedia.org/wiki/Spectrophotometry
2. The Monochromator and Its Role in the Spectrograph – Technology Networks, https://www.technologynetworks.com/analysis/articles/the-monochromator-and-its-role-in-the-spectrograph-369390
3. Beer-Lambert Law | Transmittance & Absorbance, https://www.edinst.com/resource/the-beer-lambert-law/
4. Spectrophotometer: A Comprehensive Guide to Principles, Types, and Applications, https://www.testing-instruments.com/blog/spectrophotometer-a-comprehensive-guide-to-principles-types-and-applications/
5. Monochromator vs. Spectrometer | BMG LABTECH, https://www.bmglabtech.com/en/blog/difference-between-a-spectrometer-and-a-monochromator/
6. Monochromator – Berthold Technologies GmbH & Co.KG, https://www.berthold.com/en-us/bioanalytics/knowledge/glossary/monochromator/
7. Characteristics of Single and Double Monochromator UV-VIS Spectrophotometers, https://www.shimadzu.com/an/service-support/technical-support/analysis-basics/fundamentals-uv/single_double.html
8. Worked example: Calculating concentration using the Beer–Lambert law – Khan Academy, https://www.khanacademy.org/science/ap-chemistry-beta/x2eef969c74e0d802:intermolecular-forces-and-properties/x2eef969c74e0d802:beer-lambert-law/v/spectrophotometry-example
9. Spectrophotometer Troubleshooting Guide – Biocompare, https://www.biocompare.com/Editorial-Articles/573992-Spectrophotometer-Troubleshooting-Guide/
This guide is maintained by HINOTEK’s core technical team, comprised of senior engineers and application scientists with over two decades of hands-on experience in fields such as microscopy, centrifugation, and spectrophotometry. We are committed to ensuring that every piece of information in this guide—from instrument principles and technical specifications to laboratory procurement advice—maintains the highest level of accuracy and timeliness.