 |
Introduction: Calibrate a Spectrophotometer
In the landscape of modern analytical science, UV-Visible (UV-Vis) spectrophotometry stands as a cornerstone technique, indispensable in fields ranging from clinical chemistry and environmental monitoring to pharmaceutical quality control. This powerful method allows for the precise quantification of substances by measuring their absorption of light. However, the accuracy and reliability of this technique—and the validity of the data it produces—hinge entirely on a single, non-negotiable process: calibration.
Calibration is far more than a routine chore or a box-ticking exercise. It is the fundamental process that underpins the scientific integrity of every measurement, ensuring that an instrument performs to its specified tolerances. For a laboratory, the difference between a properly calibrated spectrophotometer and one that has drifted from its specifications is profound. It can mean the difference between a publishable result and a retracted paper, a passed product batch and a costly recall, or regulatory compliance and a critical audit finding.
This guide serves as a definitive resource for laboratory managers, senior researchers, quality assurance professionals, and scientific instrument importers and distributors. It delves into the core principles of spectrophotometer calibration, exploring the “why” behind its importance, the “what” of the critical performance parameters to be tested, and the “how” of implementing a robust, compliant calibration program. We will provide a step-by-step framework for creating a Standard Operating Procedure (SOP), guidance on selecting the correct Certified Reference Materials (CRMs), and a practical guide to troubleshooting common failures. By understanding and implementing these principles, laboratories can ensure the highest level of data integrity, meet stringent regulatory demands, and maximize the value of their investment in analytical instrumentation.
Section 1: The Foundation of Accurate Measurement: Why Calibrate Your Spectrophotometer?
1.1 Beyond Routine Checks: The Role of Calibration in Data Integrity and Reproducibility
At its core, calibration is the process of verifying and adjusting an instrument’s performance to a known, traceable standard. This establishes a foundational reference point, ensuring that the spectrophotometer measures what it is intended to measure with a high degree of accuracy. Over time, all analytical instruments are subject to drift due to factors like aging components (especially light sources), changes in ambient temperature and humidity, and general wear and tear. Calibration is the formal process that identifies and corrects for these deviations, guaranteeing that the data generated is not only accurate at a single point in time but is also reproducible over the long term and comparable across different instruments and laboratories.
Furthermore, proper calibration ensures traceability, a critical concept in metrology. By using Certified Reference Materials (CRMs) whose values are linked to primary standards from National Metrology Institutes like the National Institute of Standards and Technology (NIST), calibration creates an unbroken chain of comparisons. This provides objective, scientifically defensible evidence of an instrument’s accuracy, a cornerstone of quality management and regulatory compliance.
1.2 Meeting Regulatory Demands: Compliance with Pharmacopeias and Quality Standards
In regulated industries, particularly the pharmaceutical sector, spectrophotometer calibration is not merely a best practice; it is a mandatory requirement. Quality control frameworks such as ISO 9001, Good Laboratory Practice (GLP), and Good Manufacturing Practice (GMP) all mandate the regular performance testing and validation of analytical instruments to ensure they are fit for purpose.
Major international pharmacopeias provide explicit guidance on the parameters and acceptance criteria for UV-Vis spectrophotometer calibration. Key chapters include the United States Pharmacopeia (USP) General Chapter “Ultraviolet-Visible Spectroscopy” and the European Pharmacopoeia (Ph. Eur.) Chapter 2.2.25 “Absorption spectrophotometry, ultraviolet and visible”. These standards are not static; they are periodically reviewed and updated. For instance, USP underwent significant revisions that became effective in December 2022, introducing more stringent requirements for statistical validation, such as performing multiple replicate measurements for certain tests. Adherence to the current versions of these pharmacopeias is essential for any laboratory involved in the development, manufacturing, or quality control of pharmaceutical products.
1.3 The Financial and Scientific Impact of Inaccuracy
Viewing calibration solely as a technical task overlooks its profound strategic importance. It is a proactive risk management strategy that safeguards against the cascading failures originating from a single inaccurate measurement. An uncalibrated or improperly calibrated instrument produces unreliable data, which introduces systemic errors into every subsequent analysis and decision.
The consequences of this failure chain are severe. In a quality control environment, it can lead to out-of-specification (OOS) results, triggering costly investigations, failed product batches, manufacturing delays, and, in the worst-case scenario, product recalls that carry immense financial and reputational damage. In a research and development context, inaccurate data can lead to invalid scientific conclusions, wasted resources on pursuing false leads, and the retraction of published papers. For instrument importers and distributors, the ability to demonstrate that an instrument can be reliably calibrated and validated according to global standards is a critical factor in its marketability and a safeguard against liability. Therefore, the investment in a robust calibration program—including the cost of high-quality CRMs and technician time—is an essential insurance policy against the far greater costs of analytical failure.
Section 2: Understanding the Core Calibration Parameters
A comprehensive spectrophotometer calibration involves the assessment of several key performance parameters. Each parameter evaluates a different aspect of the instrument’s optical and electronic systems, and together they provide a complete picture of its performance. Understanding these parameters is the first step toward effective calibration and troubleshooting.
2.1 Wavelength Accuracy: Are You Measuring at the Right Address?
Definition: Wavelength accuracy is the ability of the instrument to correctly select and report a specific wavelength of light. In simple terms, it verifies that the x-axis of the spectrophotometer’s output is correct.
Why it Matters: The entire principle of spectrophotometry relies on measuring absorbance at specific wavelengths where an analyte absorbs light. If the instrument’s wavelength setting is inaccurate—for example, if it is set to 280 nm but is actually outputting light at 282 nm—all subsequent measurements will be flawed. This can lead to significant errors in quantitative analysis, particularly when measuring on the steep slope of an absorption peak, and can result in the misidentification of compounds in qualitative analysis.
Causes of Inaccuracy: Wavelength errors typically arise from mechanical or optical shifts within the monochromator. This can be due to physical shock, vibrations, thermal expansion and contraction of components, or gradual misalignment of the diffraction grating or mirrors over time. The aging of the instrument’s light source, such as a deuterium lamp, can also cause its characteristic emission lines to shift, affecting internal calibration checks.
2.2 Photometric Accuracy & Linearity: Is the Instrument’s Response True and Proportional?
Definition: Photometric accuracy is the ability of the instrument’s detector and electronics to correctly measure the amount of light passing through a sample and report an absorbance (or transmittance) value that is as close as possible to the true value. Photometric linearity, a closely related concept, assesses whether the instrument’s photometric response is directly proportional to the concentration of the analyte over a specified range. This proportionality is the basis of the Beer-Lambert Law, expressed as
A=ϵcb, where A is absorbance, ϵ is the molar absorptivity, c is concentration, and b is the path length.
Why they Matter: These parameters are the heart of quantitative analysis. Any error in photometric accuracy directly translates into an error in the calculated concentration of the sample. If the instrument’s response is not linear, the calibration curve constructed from standard solutions will be invalid, making it impossible to determine the concentration of an unknown sample reliably.4 It is worth noting that while the European Pharmacopoeia specifies a distinct linearity test, the updated USP
has moved toward an approach where linearity is implicitly verified by testing photometric accuracy at multiple absorbance levels across the instrument’s operational range.
2.3 Stray Light: Quantifying the Unwanted Noise
Definition: Stray light is any unwanted or “false” light that reaches the detector but is outside the specific wavelength band selected by the monochromator.
Why it Matters: Stray light is one of the most significant sources of error in spectrophotometry, particularly for high-concentration samples that have high absorbance values. It introduces a systematic error that causes a negative deviation from the Beer-Lambert Law, making the measured absorbance appear lower than its true value. This effect effectively limits the upper end of the instrument’s usable dynamic range, as the constant signal from stray light becomes more significant as the true transmitted light diminishes.
Causes: Stray light can originate from several sources, including imperfections and scattering from optical surfaces like gratings and mirrors, light leaks from the surrounding environment into the instrument, and internal reflections within the monochromator housing (a phenomenon known as re-entrant spectra).
2.4 Spectral Resolution: Distinguishing Between Neighbors
Definition: Spectral resolution, or resolving power, is the ability of a spectrophotometer to distinguish between two adjacent spectral features, such as two closely spaced absorption peaks. This capability is fundamentally determined by the instrument’s Spectral Bandwidth (SBW), which is the width of the band of wavelengths that passes through the monochromator’s exit slit.
Why it Matters: An instrument with poor resolution may fail to separate two distinct peaks, causing them to appear as a single, broad peak. It can also “flatten” the true height of sharp absorption bands, leading to inaccurate measurements of peak maxima and, consequently, errors in both qualitative and quantitative analysis. High resolution is particularly critical for analyzing complex mixtures with overlapping spectra or compounds that exhibit fine spectral structures.
The interrelationship between these parameters is a crucial concept for effective instrument management. They are not isolated metrics; a failure in one can directly cause or mimic a failure in another. For instance, a photometric linearity test failure is very often caused by high stray light. The Beer-Lambert Law is predicated on the use of monochromatic light. Stray light introduces polychromatic radiation, violating this fundamental assumption. At high sample concentrations, where the true transmitted light is minimal, the constant background signal from stray light becomes a large proportion of the total light hitting the detector. This causes the instrument’s response to plateau, destroying linearity. Therefore, a technician observing a linearity failure should investigate stray light as a primary root cause before suspecting a more complex detector issue. Similarly, poor resolution can negatively impact wavelength accuracy by broadening peaks and making it difficult to precisely identify the true wavelength of maximum absorbance. Recognizing these causal links is key to efficient and effective troubleshooting.
Section 3: The Essential Toolkit: Selecting and Using Certified Reference Materials (CRMs)
The entire process of calibration relies on comparing the instrument’s performance against a known benchmark. These benchmarks are Certified Reference Materials (CRMs)—physical standards or chemical solutions with accurately known and documented properties. The selection and proper use of CRMs are critical for a valid and defensible calibration.
3.1 The Gold Standard: Why NIST-Traceable CRMs are Non-Negotiable
For a calibration to be meaningful, the standards used must be of a higher order of accuracy than the instrument being tested. This is achieved through the use of CRMs obtained from an accredited and recognized source. The most critical attribute of a CRM is its traceability. NIST-traceability signifies that the certified value of the standard has been determined through an unbroken chain of comparisons back to primary physical standards maintained by the National Institute of Standards and Technology (NIST) or another equivalent National Metrology Institute.
This traceability provides objective, verifiable, and legally defensible proof of measurement accuracy. When purchasing CRMs, it is imperative to ensure they are supplied with a formal Certificate of Calibration that details the certified values, the associated measurement uncertainty, the date of certification, and the traceability statement.
3.2 Liquid vs. Solid-State Standards: A Strategic Choice
CRMs for spectrophotometer calibration are available in two main forms: liquid solutions and solid-state filters. The choice between them is a strategic decision that impacts laboratory workflow, reliability, and the total cost of ownership.
 |
 |
 |
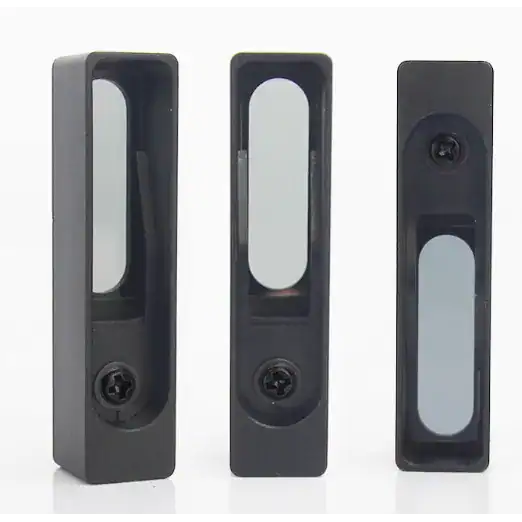
- Solid-State Standards (e.g., Holmium Oxide Glass, Didymium Glass, Neutral Density Filters):
View HINOTEK Spectrophotometer Filter here.
- Advantages: These standards are prized for their exceptional long-term stability and durability. If handled and stored correctly, they do not degrade and may never require recalibration. They are simple to use, requiring no preparation, which eliminates a significant source of operator error. Many are coated to be scratch-resistant, further enhancing their longevity.
- Disadvantages: Solid-state filters typically have a higher initial purchase price. There can also be compatibility issues, as the fixed physical form may not be suitable for the beam geometry of all spectrophotometer models. Furthermore, the glass matrix can slightly alter the absorption spectrum of the embedded material (like holmium oxide) compared to its properties in solution.
- Liquid Standards (e.g., Potassium Dichromate, Holmium Perchlorate, Potassium Chloride):
- Advantages: The primary advantage of liquid standards is that they are measured in the same manner as routine samples—as a solution in a standard cuvette. This perfectly mimics the analytical conditions of a typical experiment. Many pharmacopeia methods specifically call for the use of liquid standards.
- Disadvantages: Liquid standards have a limited shelf life and can degrade over time due to slow, irreversible chemical reactions. They are highly susceptible to operator error during preparation, including inaccuracies in weighing and dilution, as well as contamination. Many of the chemicals used, such as potassium dichromate and perchloric acid, are hazardous, requiring careful handling and disposal procedures.
While liquid standards may appear more economical upfront, a deeper analysis reveals significant hidden costs related to technician time for preparation, the risk of error necessitating re-work, recurring purchase costs due to limited stability, and hazardous material management. Solid-state standards represent a higher initial investment but offer a lower total cost of ownership by simplifying the calibration workflow, reducing long-term operational expenses, and dramatically improving the reliability and reproducibility of the calibration process. This is a powerful value proposition for any laboratory manager or purchasing agent focused on both compliance and efficiency.
3.3 Table: Recommended CRMs for Each Calibration Parameter
The following table provides a consolidated list of commonly used and pharmacopeia-recommended CRMs for each of the core calibration parameters.
| Parameter | Primary CRM | Spectral Range | Description & Use | Key Pharmacopeias |
| Wavelength Accuracy | Holmium Oxide (Solution or Glass Filter) | UV/Vis (240-650 nm) | Provides multiple sharp, well-defined peaks for verifying the x-axis. Solution is preferred by EP, but glass is more stable. | USP, EP |
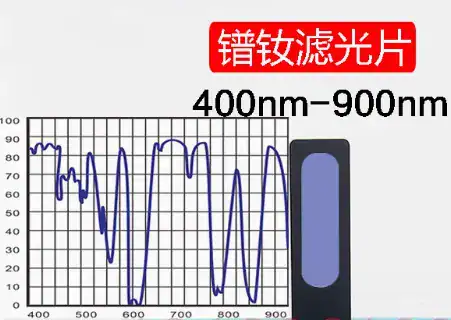
| Didymium Oxide (Glass Filter) | Vis/NIR (400-880 nm) | Used for wavelength verification at longer wavelengths, required by USP if measuring >650 nm. | USP | |
| Cerium Oxide (Solution) | Far UV (200-255 nm) | Recommended for verifying performance in the low UV range. | USP, EP | |
| Deuterium (D2) or Mercury (Hg) Lamp Lines | Specific Emission Lines (e.g., D2: 486.0, 656.1 nm) | Uses the instrument’s own lamp emission lines as a fundamental physical standard. Often used for internal/automated checks. | USP, BP | |
| Photometric Accuracy | Potassium Dichromate (PDC) Solution | UV (235-350 nm) | The most widely recognized liquid standard for UV photometric accuracy. Multiple concentrations are used to check linearity. | USP, EP, BP |
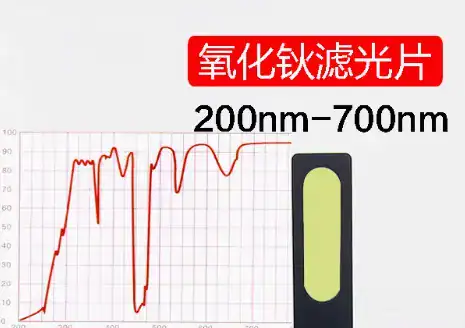
| Neutral Density (ND) Filters (Glass or Metal-on-Quartz) | Vis/NIR (400-900+ nm) | Stable, solid filters with nominally flat absorbance across the visible spectrum. Metal-on-quartz offers a wider range. | USP | |
| Stray Light | Cut-off Solutions/Filters (e.g., KCl, NaI, NaNO₂, Acetone) | Specific UV ranges | These materials are opaque at the test wavelength. Any light detected is stray light. The choice depends on the wavelength range being tested. | USP, EP, BP |
| Spectral Resolution | Toluene in Hexane Solution | UV (~266-269 nm) | The ratio of the absorbance maximum (~269 nm) to the adjacent minimum (~266 nm) is used to assess the instrument’s ability to resolve fine spectral features. | USP, EP, BP |
Section 4: A Step-by-Step Guide to Spectrophotometer Calibration: An SOP Framework
This section provides a detailed framework for a Standard Operating Procedure (SOP) for UV-Vis spectrophotometer calibration. The procedures are aligned with the stringent requirements of major pharmacopeias, particularly USP Chapter .
4.1 Pre-Calibration Checklist: Setting the Stage for Success
Before any measurements are taken, a series of preparatory steps must be completed to ensure the validity of the calibration process.
- Environment: The spectrophotometer (Find the perfect HINOTEK Spectrophotometer for your lab) must be located in a stable operating environment. This means it should be on a sturdy bench free from vibrations, away from direct sunlight or drafts from air conditioning vents, and in a room with controlled temperature and humidity. The air should also be clean and free from chemical vapors or smoke that could interfere with the optics.
- Instrument State: Power on the instrument and allow it to complete its self-diagnostic checks. Crucially, let the instrument warm up for the period specified by the manufacturer, which is typically at least 30 to 60 minutes. This warm-up period is essential for the thermal stabilization of the light sources (e.g., deuterium and tungsten lamps) and the detector electronics, ensuring a stable output signal.
- Cleanliness: A clean instrument is a prerequisite for accurate measurements. Visually inspect and clean the exterior of the instrument and the sample compartment. Most importantly, ensure that all cuvettes and/or solid reference filters are impeccably clean. Handle them only by their frosted sides to avoid fingerprints on the optical surfaces. Clean cuvettes with an appropriate spectroscopic-grade solvent and dry them with a lint-free cloth. Inspect them carefully for any scratches, chips, or residue, as these defects will scatter light and invalidate measurements.
4.2 The Universal First Step: Performing a Baseline Correction (Blanking)
Every spectrophotometric measurement is a comparative one. The instrument measures the light passing through the sample and compares it to the light passing through a reference, or “blank.” This process, known as blanking or zeroing, is essential to mathematically subtract the absorbance signal from the cuvette itself and the solvent in which the sample is dissolved. This ensures that the final reported absorbance is due only to the analyte of interest.
Procedure: Fill a clean, high-quality quartz cuvette three-quarters full with the blank solution (e.g., the specific acid used to dissolve a liquid standard, or high-purity water). Place the cuvette in the instrument’s sample holder, ensuring the clear optical windows are aligned with the light beam path. Run the instrument’s baseline correction or “zero absorbance” function. When using solid filters, the blank measurement is typically performed with an empty sample holder (i.e., an air blank).
4.3 Procedure 4.1: Verifying Wavelength Accuracy (per USP )
This procedure verifies that the instrument’s wavelength scale (x-axis) is correct.
- Standard Selection: Select a CRM with certified peaks that bracket the intended operational wavelength range of the laboratory. For general UV-Vis work, a holmium oxide solution or glass filter is common. If measurements are performed above 650 nm, a didymium filter is also required by USP.
- Measurement:
- Perform a baseline correction using the appropriate blank (e.g., 1.4 M perchloric acid for a holmium oxide solution, or air for a glass filter).
- Place the certified wavelength standard into the sample holder.
- Set the instrument to perform a wavelength scan over the certified range of the standard.
- The instrument software will identify the wavelengths of maximum absorbance for the various peaks in the standard’s spectrum.
- For scanning (non-diode array) instruments, the USP requires at least six replicate measurements. The mean of these six measurements should be calculated for each certified peak.
- Evaluation:
- Accuracy: For each peak, calculate the difference between the mean measured wavelength and the value stated on the CRM’s certificate. This difference must fall within the acceptance criteria specified by the relevant pharmacopeia (e.g., ±1 nm in the UV range for USP).
- Precision (Repeatability): For non-diode array instruments, calculate the standard deviation (SD) of the six replicate measurements for each peak. The SD must not exceed the pharmacopeia limit (e.g., ≤ 0.5 nm for USP).
4.4 Procedure 4.2: Verifying Photometric Accuracy and Repeatability (per USP )
This procedure verifies that the instrument’s absorbance scale (y-axis) is correct and reproducible.
- Standard Selection: Select at least two (and preferably three) CRMs with different absorbance values that span the lab’s operational range. For the UV range (<400 nm), use acidic solutions of potassium dichromate (PDC). For the visible range (>400 nm), use solid neutral density (ND) filters.
- Measurement:
- Set the instrument to fixed-wavelength measurement mode at the specific wavelengths certified for the chosen standard (e.g., 235 nm, 257 nm, 313 nm, and 350 nm for PDC).
- Perform a blank measurement using the appropriate solvent (e.g., 0.001 M perchloric acid for PDC standards).
- Measure the absorbance of the first CRM. Per USP guidelines, perform at least six replicate measurements.
- Repeat this process for each of the other selected CRMs.
- Evaluation:
- Accuracy: For each standard, calculate the mean of the six absorbance readings. Compare this mean value to the certified value. The deviation must be within the acceptance limits.
- Repeatability (Precision): For each standard, calculate the standard deviation of the six replicate measurements. The SD must be below the specified limit.
4.5 Procedure 4.3: Measuring Stray Light (per USP )
This procedure quantifies the level of stray radiation in the instrument at a specific wavelength.
- Standard Selection: Choose a stray light cut-off solution or filter that is appropriate for the wavelength region of interest. A 1.2% w/v solution of potassium chloride (KCl) in water is commonly used for testing at 198 nm.
- Measurement:
- Set the instrument to a fixed wavelength of 198 nm.
- Use high-purity water as the reference/blank.
- Measure the absorbance of the 1.2% KCl solution.
- Evaluation: The KCl solution is essentially opaque at 198 nm. Therefore, any light that is transmitted and detected is considered stray light. A high absorbance reading corresponds to low transmission and thus low stray light. The measured absorbance must be greater than the limit specified in the pharmacopeia (e.g., > 2.0 Absorbance units).
4.6 Procedure 4.4: Testing Spectral Resolution (per USP )
This procedure assesses the instrument’s ability to resolve fine spectral detail.
- Standard Selection: Prepare a 0.02% v/v solution of toluene in spectroscopic-grade hexane.
- Measurement:
- Use the hexane solvent as the reference/blank.
- Perform a wavelength scan of the toluene solution from approximately 260 nm to 275 nm.
- From the resulting spectrum, determine the absorbance value at the peak maximum (which occurs at approximately 269 nm) and the absorbance value at the adjacent trough, or minimum (at approximately 266-267 nm).
- Evaluation: Calculate the ratio of the absorbance at the maximum to the absorbance at the minimum (Amax/Amin). This ratio must meet or exceed the limit set by the pharmacopeia (e.g., ≥ 1.3 for USP, ≥ 1.5 for BP/IP).
4.7 Table: USP & Ph. Eur. Acceptance Criteria Summary
This table serves as a quick-reference guide for the key acceptance criteria defined by the United States and European Pharmacopoeias.
| Parameter | Pharmacopeia | Acceptance Criteria |
| Wavelength Accuracy | USP | UV (200-400 nm): ±1 nm; Vis (400-900 nm): ±2 nm |
| Ph. Eur. 2.2.25 | UV (<400 nm): ±1 nm; Vis (>400 nm): ±3 nm | |
| Wavelength Repeatability (Precision) | USP (Non-diode array) | Standard Deviation ≤ 0.5 nm |
| Photometric Accuracy (PDC in acid) | USP | ≤ 1.0 A: ±0.010 A; > 1.0 A: ±1.0% of certified value |
| Photometric Accuracy (ND Filters) | USP | ≤ 1.0 A: ±0.008 A; > 1.0 A: ±0.8% of certified value |
| Photometric Repeatability (Precision) | USP | Standard Deviation ≤ 0.005 A (for values ≤ 1.0 A) or ≤ 0.5% (for values > 1.0 A) |
| Stray Light | USP / BP | Using 1.2% KCl solution at ~198 nm, Absorbance > 2.0 A |
| Resolution | USP | Toluene in Hexane ratio (A269nm/A267nm) ≥ 1.3 |
| BP / IP | Toluene in Hexane ratio (A269nm/A266nm) ≥ 1.5 |
4.8 The Modern Advantage: Leveraging Automated Calibration Workflows
The increasingly stringent requirements of pharmacopeias, such as the USP mandate for six replicate measurements for accuracy and precision tests, represent a significant paradigm shift from older, single-point checks. The focus is now on statistical robustness, evaluating both the mean (accuracy) and the standard deviation (repeatability). This shift has a critical consequence: it makes manual calibration far more laborious, time-consuming, and susceptible to human error.
This challenge highlights the significant advantage of modern spectrophotometers that feature built-in, automated performance verification (PV) or instrument qualification (IQ/OQ) software modules. These automated workflows guide the operator through the entire process, perform the necessary replicate measurements, execute all calculations, and generate a comprehensive, traceable report. The benefits are substantial:
- Reduced Error: Automation eliminates the risk of data transcription errors and inconsistent manual procedures.
- Time Savings: What could take hours of manual work can be completed much more quickly.
- Enhanced Compliance: Automated systems are designed to meet the latest pharmacopeia requirements, providing secure, traceable documentation suitable for regulatory audits, including FDA 21 CFR Part 11 compliance.
For laboratories, this automated capability is not just a convenience feature; it is a direct solution to a major compliance and efficiency challenge, reducing risk and freeing up valuable technician time.
Section 5: Troubleshooting Common Calibration Failures: A Practical Guide
Even with careful procedure, calibration tests can fail. A failed test does not always indicate a catastrophic hardware failure. More often, the root cause is a simple, correctable issue. A systematic approach to diagnosis can save significant time, prevent unnecessary service calls, and empower laboratory personnel to maintain their instruments effectively.
5.1 A Systematic Approach to Diagnosing Calibration Errors
The most efficient troubleshooting methodology follows a logical funnel of complexity, starting with the simplest and most common sources of error before escalating to more complex and costly possibilities. This diagnostic sequence should be:
- User and Procedural Error: Verify the correct procedure was followed. Was the correct CRM used? Was the blank prepared and used correctly?
- Consumables and Sample Handling: Examine the cuvettes, solvents, and CRMs. Are cuvettes clean and unscratched? Are solvents pure? Have liquid CRMs expired or degraded?
- Environmental Factors: Check for recent changes in the lab environment. Are there temperature fluctuations or vibrations?
- Instrument Performance & Maintenance: Review basic instrument status. Is the lamp near the end of its life? Are there visible signs of dust or contamination in the sample compartment?
- Hardware Malfunction: If all other possibilities are exhausted, the issue is likely a core hardware component, such as a misaligned optic or a failing detector, which requires a service engineer.
5.2 Table: Calibration Failure Troubleshooting Guide
This table provides a practical guide for diagnosing and resolving common calibration test failures.
| Symptom / Test Failure | Possible Causes | Diagnostic Steps & Solutions |
| Wavelength Accuracy Fails (Measured peaks deviate from certified values) | 1. Instrument Not Thermally Stable: Components have not reached thermal equilibrium. 2. Incorrect/Expired CRM: Using the wrong standard or one that has degraded. 3. Optical Misalignment: The grating or mirrors have shifted due to physical shock. 4. Aging Light Source: The deuterium lamp’s characteristic emission lines have shifted, or hydrogen contamination is causing interference. 5. Incorrect Slit Width / Spectral Bandwidth: The SBW setting is too wide, which broadens the peak and can shift the apparent maximum. |
1. Solution: Ensure the instrument has warmed up for the manufacturer-recommended time (e.g., 30-60 minutes). Check for and mitigate sources of temperature fluctuations in the lab. 2. Solution: Double-check that the correct CRM was used and verify its certificate of calibration. If using a liquid standard, ensure it has not passed its expiry date. Try a new or different certified standard. 3. Solution: Run the instrument’s internal diagnostic or self-calibration routine, if available. If the failure persists, the instrument requires realignment by a qualified service engineer. 4. Solution: Check the lamp’s usage hours in the instrument’s software. If it is near the end of its rated life, schedule a replacement by a service engineer. 5. Solution: Verify that the SBW setting used for the test matches the method requirements and the conditions under which the CRM was certified. |
| Photometric Accuracy/Linearity Fails (Absorbance deviates from certified value, especially at high absorbance) | 1. High Stray Light: This is the most frequent cause of photometric non-linearity at high absorbance values. 2. Dirty/Scratched/Mismatched Cuvettes: Scratches scatter light, while residue can absorb light. Using different cuvettes for the blank and sample introduces path length and optical mismatch errors. 3. Incorrect Blank: The blank solution is contaminated, was prepared from a different solvent batch than the standard, or has evaporated. 4. Incorrect Standard Preparation: Errors in weighing or dilution when preparing liquid standards like PDC. 5. Detector Degradation or Saturation: The photodetector is no longer responding linearly to light intensity. |
1. Diagnosis: Immediately run the Stray Light test (Procedure 4.3). If this test fails, addressing the stray light issue is the priority. 2. Solution: Meticulously clean all cuvettes with spectroscopic-grade solvent and a lint-free wipe. Inspect for scratches under a bright light and discard any that are damaged. For highest accuracy, always use the same high-quality quartz cuvette for both the blank and sample measurements. 3. Solution: Prepare a fresh blank using the exact same solvent used for the standard. Re-blank the instrument immediately before measuring the standard. 4. Solution: Prepare a fresh set of standards, paying rigorous attention to analytical weighing and volumetric techniques. To eliminate this variable entirely, use a solid-state neutral density filter for verification. 5. Solution: If all other potential causes have been systematically ruled out, this points to a hardware issue that requires diagnosis by a service engineer. |
| Stray Light Test Fails (Absorbance is lower than the required limit, e.g., < 2.0 A) | 1. Light Leaks: The sample compartment cover is not closed or sealing correctly, or there is damage to the instrument housing allowing ambient light to enter. 2. Degraded/Dirty Internal Optics: A film of dust or chemical vapor has settled on the internal mirrors, lenses, or the grating, causing excessive light scattering. 3. Imperfect Diffraction Grating: The grating itself has manufacturing flaws that cause scattering. This is an inherent property of the instrument. 4. Room Light Interference: Extremely bright overhead lighting can sometimes leak into the instrument. |
1. Diagnosis: Ensure the sample compartment lid is fully closed and latches properly. Check for any visible damage to the instrument casing. Try running the test in a completely darkened room to see if the result improves. 2. Solution: This requires professional servicing. Do not attempt to open the instrument casing to clean internal optics, as this can cause misalignment and further damage. 3. Solution: This is an instrument design limitation, not a failure that can be fixed. Instruments with double monochromators and high-quality holographic gratings have inherently lower stray light levels. This is a critical specification to consider when purchasing an instrument. 4. Solution: Dim the room lights during the test to rule out this simple source of interference. |
| Resolution Test Fails (Toluene/Hexane ratio is below the required limit) | 1. Incorrect Spectral Bandwidth (SBW): The SBW is set too wide, preventing the instrument from resolving the closely spaced peak and trough. 2. Optical Misalignment: The monochromator components (grating, slits) are not correctly aligned, degrading the instrument’s resolving power. 3. Hardware Issue: A problem with the grating drive mechanism or the detector is preventing proper function. |
1. Solution: Check the instrument’s method parameters. Ensure the narrowest available SBW is selected for the test, as required by the procedure. 2. Diagnosis/Solution: This is a significant hardware problem. Run any available internal diagnostic tests. The instrument will require realignment by a service engineer. 3. Diagnosis/Solution: If alignment is confirmed to be correct, this indicates a more severe hardware issue that requires professional service. |
Section 6: Maintaining Peak Performance: Calibration Frequency and Documentation
A successful calibration program is not a one-time event but a continuous process of verification and documentation. Establishing an appropriate calibration frequency and maintaining meticulous records are essential for ensuring ongoing compliance and instrument reliability.
6.1 Establishing a Risk-Based Calibration Schedule: How Often is Enough?
The required frequency of calibration is a common point of confusion, with recommendations ranging from daily to annually. The most effective approach is a tiered, risk-based schedule that combines frequent performance checks with less frequent, full qualifications.
- Tier 1: Daily or Per-Use Performance Checks (Standardization): Before starting a new batch of analyses or at regular intervals (e.g., every eight hours), a simple performance check should be conducted. This typically involves running a new baseline correction (blank) and measuring a single, stable check standard (like a neutral density filter) to confirm the instrument has not drifted significantly. This process is often referred to as “standardization”.
- Tier 2: Periodic Full Calibration (Qualification): The comprehensive, multi-parameter qualification described in Section should be performed on a periodic basis. The exact frequency depends on a risk assessment of the instrument’s usage:
- High-Risk / High-Use Environments: In a GMP-regulated pharmaceutical QC lab where the data directly impacts product release, a full qualification may be required quarterly or semi-annually.
- Moderate-Risk / Lower-Use Environments: For many academic research or industrial R&D labs, a full qualification performed annually is often sufficient, provided performance checks are passed consistently.
- Event-Triggered Calibration: A full qualification must always be performed following any significant event, such as a major repair or maintenance (e.g., lamp replacement), relocation of the instrument, or if routine performance checks repeatedly fail or show an anomalous trend.
6.2 The Importance of a Detailed Calibration Log for Audits and Quality Control
The calibration log is more than just a record; it is the primary evidence that proves an instrument was performing within its validated specifications at the time a particular sample was analyzed. During a regulatory audit by agencies like the FDA or an ISO assessment, the calibration log will be one of the first documents requested.
Beyond compliance, meticulous documentation creates a performance history for the instrument. This historical data is invaluable for long-term trend analysis and for troubleshooting. By transforming the calibration log from a static record into a dynamic, predictive tool, a lab manager can elevate their quality program. Plotting key calibration results over time—such as the deviation of a specific wavelength peak or the absorbance of a check standard—can reveal gradual, consistent drift. This trend can predict an impending component failure
before it results in a critical out-of-tolerance event, allowing for proactive maintenance to be scheduled, maximizing instrument uptime and preventing costly analytical failures.
6.3 Template: Essential Fields for a Spectrophotometer Calibration Log
An effective calibration log should be comprehensive and unambiguous. The following template outlines the essential fields for a compliant and useful record, which can be adapted into a laboratory’s official SOP.
SPECTROPHOTOMETER CALIBRATION LOG:
Instrument Details:
- Instrument ID / Asset Number: _______________
- Instrument Model: _______________
- Serial Number: _______________
- Location (Lab/Room): _______________
Calibration Event Record:
- Date of Calibration: YYYY-MM-DD
- Next Calibration Due: YYYY-MM-DD
- Calibrated By (Name/Initials): _______________
- Calibration Type: [ ] Annual Qualification [ ] Quarterly [ ] Post-Maintenance [ ] Other: _______________
Parameter Test Results:
| Parameter Tested | CRM Used (Name, Lot #, Cert #) | Certified Value(s) | Measured Value(s) (Mean) | Acceptance Criteria | Deviation | SD (if applicable) | Status (Pass/Fail) |
| Wavelength Accuracy | |||||||
| Photometric Accuracy | |||||||
| Stray Light | |||||||
| Resolution | |||||||
| (Add rows as needed for each standard/wavelength tested) |
Overall Summary:
- Overall Calibration Status: [ ] PASS [ ] FAIL
- Comments / Actions Taken: (e.g., “Instrument passed all tests.” or “Wavelength accuracy failed initially. Ran internal diagnostics and re-tested. Passed on second attempt. See attached diagnostic report.”)
- Reviewed By (Name/Title): _______________
- Date of Review: YYYY-MM-DD
Conclusion: Calibration as a Cornerstone of Quality and Confidence
The rigorous, regular, and well-documented calibration of a UV-Vis spectrophotometer is not an impediment to laboratory workflow, but rather its greatest enabler. It is the disciplined practice that transforms a sophisticated piece of optical equipment from a simple light-measuring device into a validated, trustworthy, and compliant scientific instrument.
Proper calibration provides unshakable confidence in every data point generated. It ensures that results are accurate, reproducible, and defensible, meeting the strictest global standards set by pharmacopeias and regulatory bodies. Ultimately, it is the process that safeguards the scientific and financial integrity of the entire laboratory. By embracing calibration not as a burden but as a cornerstone of quality, researchers and manufacturers can ensure their work stands up to the highest levels of scrutiny, driving innovation and delivering safe, effective products to the market.
For organizations seeking instruments designed with compliance and reliability at their core, and for expert partnership in establishing robust calibration protocols, HINOTEK provides both the technology and the expertise to achieve unparalleled data integrity.
If you’d like to learn more about Spectrophotometer, please browse our page: What Is a Spectrophotometer & How Does It Work? The Ultimate Guide
This guide is maintained by HINOTEK’s core technical team, comprised of senior engineers and application scientists with over two decades of hands-on experience in fields such as microscopy, centrifugation, and spectrophotometry. We are committed to ensuring that every piece of information in this guide—from instrument principles and technical specifications to laboratory procurement advice—maintains the highest level of accuracy and timeliness.
This content is regularly reviewed and updated to reflect the latest industry standards and technological advancements. We value feedback from the global scientific community. Should you have any questions or suggestions, or wish to discuss any technical details, please do not hesitate to contact our expert team at [email protected].