|
|

Meta Description: An expert guide to understanding the colorimeter. Explore its principles, types (tristimulus vs. photometric), applications in QC, and the key differences between a colorimeter and a spectrophotometer. The ultimate resource for labs and industry professionals.
In a globalized world, where components for a single product may be manufactured on different continents, the challenge of maintaining color consistency is more critical than ever. From the precise shade of an automotive coating to the identifying color of a pharmaceutical tablet, objective color measurement is not a luxury—it is a fundamental necessity for quality control, brand integrity, and regulatory compliance. The core problem is that human color perception, while remarkable, is inherently subjective and unreliable. It can be influenced by factors like lighting, background colors, and even observer fatigue. To overcome this subjectivity, industries and laboratories rely on specialized instruments to quantify color and express it in objective, numerical terms.
The primary tool for this task is the colorimeter. However, a significant point of confusion arises from the fact that the term “colorimeter” refers to two fundamentally different types of instruments, each designed for a distinct purpose. One is used in industrial quality control to measure the color of surfaces, while the other is used in analytical chemistry to measure the concentration of substances in a solution.
This definitive guide will demystify the world of colorimetry for importers, distributors, researchers, and quality control professionals. We will dissect the principles, components, and applications of both types of colorimeters, with a primary focus on the tristimulus instruments used for industrial quality control. We will explore the science of color space, provide a critical comparison between colorimeters and their more advanced counterparts, spectrophotometers, and offer practical guidance on selecting and using the right instrument for your specific needs. By the end of this guide, you will be equipped with the expert knowledge to make an informed decision and integrate precise color measurement into your quality workflow.
The Two Faces of Colorimetry: A Tale of Two Instruments
The first and most critical step in understanding colorimeters is to recognize that the term encompasses two distinct classes of devices. This divergence is not merely semantic; it reflects a fundamental split in application, one rooted in analytical chemistry and the other in the psychophysics of human vision. Selecting the wrong instrument based on a simple name search can be a costly error, leading to the acquisition of a tool that is functionally useless for the intended task. This section clarifies that crucial distinction.
The Tristimulus Colorimeter: Quantifying Color as We See It
When professionals in manufacturing, printing, or textiles refer to a colorimeter, they are almost always talking about a tristimulus colorimeter. This instrument is also known as a color difference meter or, in some contexts, a chroma meter.
- Core Function: The primary purpose of a tristimulus colorimeter is to measure the color of a surface and quantify the difference between that sample and a known color standard. It is designed to mimic the way the human eye perceives color, answering the essential quality control question: “Does the color of my product match the master standard?”.
- Principle of Operation: This device operates on the tristimulus principle of color vision, which states that any color can be represented as a mixture of three primary colors. The instrument uses a controlled internal light source to illuminate a sample. The reflected light then passes through a set of three filters—typically red, green, and blue (RGB)—before reaching a detector. These filters are precisely engineered to replicate the spectral sensitivity of the average human eye’s cone cells, as defined by the International Commission on Illumination (CIE) Standard Observer.
- Key Applications: Its main role is in industrial quality control for rapid “pass/fail” assessments on the production line. It is indispensable for ensuring batch-to-batch consistency in industries like plastics, paints and coatings, textiles, and food manufacturing.
- Data Output: The instrument’s processor converts the signals from the detector into tristimulus values (e.g., CIE XYZ). These values are then typically transformed into a more intuitive, perceptually uniform color space like CIE L*a*b*, which makes it easy to communicate and evaluate color differences numerically.
The Photometric Colorimeter: Measuring Concentration Through Color
In a chemistry, biochemistry, or environmental science laboratory, a “colorimeter” refers to a completely different device: a photometric or absorbance colorimeter.
- Core Function: This type of colorimeter is a simplified photometer used to determine the concentration of a colored solute within a liquid solution. It answers the analytical question: “How much of a specific substance is dissolved in this sample?”
- Principle of Operation: Its operation is governed by the Beer-Lambert Law. This fundamental law of photometry states that the amount of light absorbed by a solution is directly proportional to the concentration of the absorbing solute and the path length of the light traveling through the solution. The relationship is expressed by the equation: A=ϵcl
Where:
- A is absorbance (no units)
- ϵ (epsilon) is the molar absorptivity coefficient, a constant specific to the substance at a given wavelength
- c is the concentration of the solute
- l is the path length of the sample holder (cuvette), typically 1 cm
- Key Applications: Photometric colorimeters are workhorses in clinical laboratories for a vast range of biochemical assays, such as measuring blood glucose or urea concentration. They are also widely used for water quality testing to screen for chemicals like chlorine, fluoride, or iron, and in research labs to monitor the growth of bacterial or yeast cultures.
- Instrumentation: The device is relatively simple, consisting of a light source (often a filament lamp or LED), a colored filter to select a specific band of wavelengths that the solute absorbs most strongly, a slot for a sample holder called a cuvette, and a photodetector to measure the intensity of the light that is transmitted through the solution.
The Anatomy of Color Measurement: How a Tristimulus Colorimeter Works
To trust an instrument’s measurement, it is essential to understand how it arrives at its result. The process inside a tristimulus colorimeter is a sophisticated chain of events that translates the physical phenomenon of light into a simple, actionable business decision: “Pass” or “Fail.” This journey involves converting light into an electrical signal, modeling that signal to match human vision, and finally, calculating a single number that represents color difference.
Core Components and the Path of Light
 |
A tristimulus colorimeter, whether a portable handheld unit or a benchtop model, is built around a set of core components that work in concert to capture and quantify color.
- Light Source: The process begins with a stable and consistent light source. This is often a low-voltage tungsten filament lamp or, in more modern instruments, a long-lasting light-emitting diode (LED) array. The key requirement is that the source provides reliable illumination across the entire visible spectrum (typically 400 nm to 700 nm).
- Lenses and Aperture: Light from the source is focused by a series of lenses into a directed beam. An aperture, which is a small opening, controls the size of the measurement area on the sample’s surface.
- Tristimulus Filters: This is the heart of the instrument and what distinguishes it from other devices. After the light reflects off the sample, it passes through a set of three (or sometimes four) specialized optical filters: red, green, and blue. These filters are not arbitrary; they are meticulously designed to have spectral transmission characteristics that mimic the CIE Standard Observer’s color-matching functions (xˉ,yˉ,zˉ). This is the critical step that allows the instrument to “see” color in a way that correlates with human perception.
- Detector: After passing through the filters, the light strikes a photoelectric detector, such as a silicon photodiode or a photoresistor. This component’s job is to convert the light energy it receives into a proportional electrical signal. A stronger light intensity produces a stronger electrical signal.
- Processor and Display: A built-in microprocessor takes the electrical signals from the detector for each of the three filters. It uses this information to calculate the tristimulus values of the sample’s color. This data is then often converted into a more user-friendly color space and shown on a digital display as either transmittance (a linear scale from 0-100%) or absorbance (a logarithmic scale).
The Language of Color: A Deep Dive into CIE L*a*b* (CIELAB) Color Space
The raw tristimulus values (XYZ) calculated by the colorimeter are not intuitive for describing color appearance. To solve this, the International Commission on Illumination (CIE) developed the CIE L*a*b* (or CIELAB) color space in 1976. Its goal was to create a “perceptually uniform” system, where a numerical change of a given magnitude corresponds to a similar perceived change in color, regardless of where you are in the color space. This makes CIELAB a device-independent, universal language for communicating color.
The CIELAB system plots colors in a three-dimensional space based on the opponent-color theory of human vision, which posits that we cannot perceive reddish-greens or yellowish-blues simultaneously. The three axes are:
- L∗ (Lightness): This is the vertical axis, representing lightness. It runs from 0 (perfect black) to 100 (perfect white).
- a∗ (Red-Green Axis): This axis represents the balance between red and green. Positive a∗ values indicate redness, while negative a∗ values indicate greenness. A value of a∗=0 represents a neutral gray.
- b∗ (Yellow-Blue Axis): This axis represents the balance between yellow and blue. Positive b∗ values indicate yellowness, while negative b∗ values indicate blueness. A value of b∗=0 also represents a neutral gray.
By using these three coordinates, any color that the human eye can perceive can be assigned a specific location in this 3D space, making it easy to describe and compare colors objectively.
Measuring What Matters: Interpreting Color Difference with Delta E (ΔE*)
For quality control, knowing the absolute color of a sample is less important than knowing how different it is from the approved standard. This is where Delta E (ΔE*) comes in. Delta E is a single number that represents the total distance—or difference—between two colors plotted in the CIELAB space. It is the ultimate metric for a “pass/fail” decision.
Understanding how to interpret ΔE* values is critical for any QC manager. While tolerances vary by industry and application, a general guide is as follows:
- ΔE* ≤ 1.0: The difference is not perceptible to the human eye. This is considered an excellent or perfect match, often required for high-end applications.
- ΔE* 1.0 – 2.0: A very slight difference is perceptible only to a trained eye under close observation. This is typically considered a good, commercially acceptable match.
- ΔE* 2.0 – 3.5: The difference is perceptible at a glance. For many industrial applications, this range represents the upper limit of acceptable tolerance.
- ΔE* > 3.5: The colors are clearly different. This would almost always be considered a “fail” in a quality control setting.
It is also important for experts to know that several formulas for calculating ΔE* have been developed over the years. The original 1976 formula (ΔE*76) was a simple Euclidean distance. However, later formulas like CIE94 (ΔE*94) and especially CIEDE2000 (ΔE*2000) were introduced to better align with human visual perception, which is less sensitive to changes in certain color regions (like neutral grays) and more sensitive in others. Today, ΔE*2000 is considered the gold standard for most industrial applications.
Colorimeter vs. Spectrophotometer: Choosing the Right Tool for the Job
One of the most frequent and critical questions faced by lab managers and procurement specialists is whether to purchase a colorimeter or a spectrophotometer. While both measure color, they do so in fundamentally different ways, and the choice between them is not merely a matter of budget but a strategic decision based on application, risk, and the need for data. A colorimeter is a tool for process control—efficiently managing known variables in a stable production environment. A spectrophotometer is a tool for quality assurance and innovation—mitigating unknown risks and enabling complex tasks like color formulation.
The Core Distinction: A Snapshot of Color vs. a Full-Spectrum Fingerprint
The essential difference lies in how each instrument “sees” color.
A colorimeter provides a snapshot of a color. As discussed, it uses three filters (RGB) to mimic the human eye. It effectively tells you, “Based on how a human would see it, this color is composed of X amount of red, Y amount of green, and Z amount of blue.” It quantifies the perceived color but is blind to the underlying physics of how that color is produced.
A spectrophotometer, in contrast, provides a complete spectral fingerprint of the color. Instead of just three filters, it uses a sophisticated optical component like a prism or a diffraction grating to split the reflected light into many narrow bands across the entire visible spectrum (and sometimes beyond, into UV and IR). It measures the precise amount of light reflected from the sample at each individual wavelength (e.g., at 400 nm, 410 nm, 420 nm, and so on). The result is a spectral reflectance curve—a unique graph that serves as the color’s unambiguous fingerprint.
This difference leads to a critical consequence related to a phenomenon called metamerism. Metamerism occurs when two objects appear to be the same color under one lighting condition (e.g., fluorescent office light) but look different under another (e.g., natural daylight). Because a colorimeter only sees the final RGB “recipe,” it cannot detect metamerism. If two samples produce the same tristimulus values, the colorimeter will see them as a match, even if their spectral fingerprints are different. A spectrophotometer, however, can compare the full spectral curves of the two objects. If the curves do not match, it can flag them as a potential metameric pair, a crucial capability for industries where components are sourced globally and must match under all lighting conditions.
Head-to-Head Comparison: Performance, Application, and Cost
To aid in the selection process, the following table provides a direct comparison of the key attributes of tristimulus colorimeters and spectrophotometers.
| Feature | Colorimeter | Spectrophotometer |
| Principle of Operation | Tristimulus (RGB filters), mimics human eye perception. | Full-spectrum analysis using a prism or diffraction grating. |
| Accuracy & Precision | Good for routine quality control but generally less precise. | High precision and accuracy, considered the “gold standard” for color measurement. |
| Wavelength Range | Typically limited to the visible spectrum (400–700 nm). | Wider range, often including UV and near-infrared (e.g., 200–800 nm or greater). |
| Metamerism Detection | No. This is a significant limitation. | Yes. This is a primary advantage for complex supply chains. |
| Primary Use Case | Routine QC, pass/fail decisions, comparing similar colors. | Color formulation (R&D), creating color standards, complex QC, diagnosing color issues. |
| Versatility | Limited. Best for measuring color difference on opaque surfaces. | Highly versatile. Can measure solids, liquids, and gases; attributes like opacity, haze, and fluorescence. |
| Cost | More economical and budget-friendly. | A more significant financial investment. |
| Portability | Often designed as small, highly portable handheld devices. | Available in both portable handheld and larger, more powerful benchtop models. |
Decision Guide: When to Choose a Colorimeter vs. a Spectrophotometer
Making the right choice depends entirely on your application, budget, and the level of risk you are willing to accept.
Choose a Colorimeter if:
- Your primary need is for fast, straightforward pass/fail quality control on a production line where speed and ease of use are paramount.
- You are consistently measuring color on the same material from the same supplier, minimizing the risk of metamerism.
- Your budget is a primary constraint, and you need a cost-effective solution for basic color comparison.
- You require a highly portable, lightweight device for quick spot-checks in the field or on the factory floor.
Invest in a Spectrophotometer if:
- You are involved in research and development (R&D) or color formulation, where you need to create colors from scratch and understand the properties of pigments and dyes.
- You need to maintain tight color consistency across a complex supply chain involving different materials, textures, or suppliers, where the risk of metamerism is high.
- Your products have special effect finishes, such as metallic, pearlescent, or fluorescent colors, which require multi-angle or full-spectrum measurement to characterize properly.
- You need to measure attributes beyond just color, such as opacity, haze, or the influence of optical brightening agents (OBAs) in paper and textiles.
- The absolute accuracy and integrity of your color data are critical for setting corporate-wide color standards or for legal and contractual compliance.
Decoding the Spec Sheet: Geometry and Aperture Explained
Once you have decided between a colorimeter and a spectrophotometer, the next step is to select the correct configuration for your specific application. Two of the most critical specifications on any color measurement instrument are its optical geometry and aperture size. These are not just minor features; they are fundamental variables that determine how the instrument interacts with your sample and can drastically affect the measurement results. Understanding them is essential for developing a robust and repeatable Standard Operating Procedure (SOP).
Optical Geometry: How the Instrument “Views” a Sample
Optical geometry refers to the fixed angles of illumination (where the light comes from) and viewing (where the detector is placed). This arrangement is critical because it dictates how the instrument accounts for surface characteristics like gloss and texture. The two most common geometries in industrial color measurement are 45°/0° and d/8° (sphere).
45°/0° (or 0°/45°) Geometry
- Description: In a 45°/0° (pronounced “forty-five zero”) instrument, the light source illuminates the sample surface at a 45-degree angle, and the detector is positioned directly above the sample at 0 degrees (perpendicular) to capture the reflected light. The reverse, 0°/45°, is functionally equivalent.
- Key Characteristic: This geometry is designed to exclude specular reflection—the direct, mirror-like glare you see from a glossy surface. Because it ignores this glare, the measurement is influenced by the sample’s surface texture and gloss level. This makes its results correlate very closely with how the human eye perceives color and overall appearance. A high-gloss sample and a matte sample of the exact same colorant will give different readings on a 45°/0° instrument, just as they look different to our eyes.
- Best For: Quality control of finished products where the final visual appearance is the most important factor. It is ideal for measuring smooth or matte surfaces, printed materials, and interior automotive components where different parts must appear to match.
d/8° (Sphere) Geometry
 |
- Description: In a d/8° (pronounced “d eight”) instrument, the sample is illuminated diffusely from all directions. This is achieved by using an integrating sphere—a hollow sphere coated on the inside with a highly reflective, diffusing material (like barium sulfate). The light bounces around inside the sphere, striking the sample from every angle. The detector is then positioned at an 8-degree angle from the perpendicular to view the reflected light.
- Key Characteristic: The primary advantage of sphere geometry is its ability to measure color either with or without the influence of surface appearance. This is done using a small port called a gloss trap or specular port.
- SCI (Specular Component Included): When the gloss trap is closed, the instrument captures all reflected light, both the diffuse reflection (color) and the specular reflection (gloss). This measurement provides the “true” color of the object, effectively ignoring the effects of surface texture or gloss level. A high-gloss and a matte sample of the same colorant will give nearly identical readings in SCI mode.
- SCE (Specular Component Excluded): When the gloss trap is open, the specular reflection escapes, and the instrument measures only the diffuse reflection. This measurement is similar to that of a 45°/0° instrument and is dependent on surface appearance.
- Best For: Sphere instruments are the most versatile. The SCI mode is essential for color formulation and recipe creation, as it measures the true color of the pigment itself. It is also the preferred geometry for measuring highly textured surfaces like textiles, carpets, and plastics, as the diffuse illumination averages out the effect of the texture. The ability to switch between SCI and SCE makes it a powerful tool for both R&D and advanced quality control.
Aperture Size: Matching the Measurement Area to the Sample
The aperture is the physical opening in the instrument through which it views and measures the sample. The size of this aperture determines the measurement area, and choosing the correct size is crucial for obtaining accurate and repeatable data.
|
|
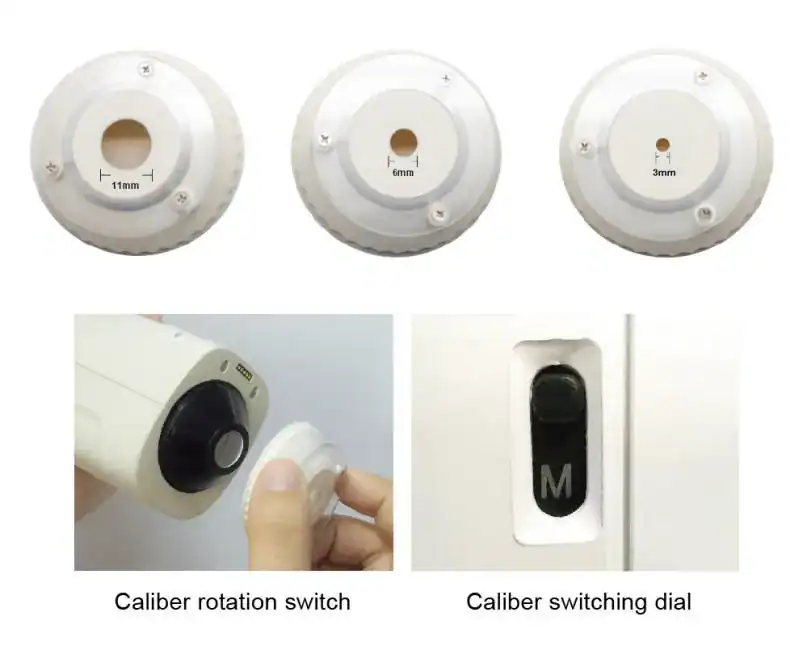
- Large Apertures (e.g., 8 mm and larger): These are best suited for measuring large, relatively uniform samples like painted panels, large plastic plaques, or wide swaths of textile fabric. A larger aperture averages the color measurement over a wider area, which helps to minimize the influence of small imperfections, minor texture variations, or inconsistent patterns. As a general rule, a larger aperture allows more light to reach the sensor, which typically results in more repeatable measurements.
- Small Apertures (e.g., 4 mm and smaller): These are necessary when measuring small samples, small parts, or when you need to isolate a very specific area of a larger object. They are essential for measuring the color of small printed control patches, intricate patterns on fabric, or avoiding a surface defect. The trade-off is that positioning becomes more critical, and they are more sensitive to tiny variations on the sample surface.
Best Practice: For maximum accuracy and repeatability, always use the largest aperture that can fit entirely within the uniform colored area of your sample. When comparing data between different instruments or different locations, it is imperative to use the same aperture size for all measurements to ensure the results are comparable.
The Colorimeter in Action: A Survey of Industrial Applications
The true value of a colorimeter is realized in its application—solving real-world challenges of quality, consistency, and compliance across a multitude of industries. By providing objective, numerical color data, these instruments remove subjectivity and enable data-driven decisions.
Quality Control in Paints, Coatings, and Plastics
In these industries, color is not just an aesthetic choice; it is a critical component of brand identity and product performance. The challenge is to ensure that a can of paint purchased today matches one purchased a year ago, or that a plastic car bumper manufactured in Mexico perfectly matches a metal door painted in the United States.
- Solution: Portable colorimeters are deployed on the factory floor for quick pass/fail checks of finished parts, ensuring they fall within a pre-set tolerance. For more complex tasks, such as formulating a new paint color or ensuring components from different suppliers will not exhibit metamerism, benchtop spectrophotometers are essential. These processes are often governed by industry standards like
ASTM E1347 (Standard Test Method for Color and Color-Difference Measurement by Tristimulus Colorimetry) and ASTM D2244 (Standard Practice for Calculation of Color Tolerances and Color Differences from Instrumentally Measured Color Coordinates), which provide a standardized framework for measurement and communication.
Color Consistency in Textiles and Apparel
For the textile industry, color control is a multi-stage process. It begins with the evaluation of raw fibers and continues through dye formulation, production dyeing, and final inspection of the finished fabric.
- Solution: Colorimeters and spectrophotometers are used to create precise dye recipes, reducing the costly trial-and-error process. They are also used to test for color fastness—a fabric’s ability to resist fading or bleeding when exposed to washing, rubbing, or sunlight. Furthermore, they ensure that different materials in a single garment, such as the fabric, thread, and plastic buttons, all match under retail lighting and daylight.
Ensuring Appeal and Safety in the Food & Beverage Industry
For consumers, color is the primary indicator of a food product’s quality, freshness, and even its expected flavor. An “off-colored” product can be immediately rejected, regardless of its actual quality.
- Solution: Colorimeters are used extensively to monitor and control the color of a vast array of products. They can quantify the “doneness” of baked goods like bread and cookies, ensure the consistent red of a ketchup brand, verify the ripeness of tomatoes, and monitor the color of beverages from fruit juice to beer. This objective measurement ensures batch-to-batch consistency, which is key to brand recognition, and can also serve as an early warning system for spoilage or contamination.
Precision and Compliance in Pharmaceuticals
In the pharmaceutical industry, color is a critical safety feature. The specific color and shade of a tablet or capsule serve as a primary identifier for patients and healthcare providers, helping to prevent dangerous dosage errors. Color can also be an indicator of a drug’s stability and integrity over time.
- Solution: High-precision color measurement is used for the quality control of raw materials and excipients, to ensure the uniformity of tablet coatings, and as a key part of stability testing programs. These processes must adhere to strict regulatory guidelines from bodies like the U.S. Food and Drug Administration (FDA) concerning color additives. Consequently, many pharmaceutical labs require QC software with features that support compliance with regulations like
21 CFR Part 11, which mandates secure electronic records and signatures.
Applications in Water Quality, Printing, and Beyond
The utility of colorimeters extends to many other fields:
- Water Quality Testing: Photometric colorimeters are vital for environmental and municipal testing. By adding a specific reagent to a water sample that causes a color change in the presence of a target chemical, the instrument can accurately measure the concentration of contaminants like chlorine, fluoride, iron, and dissolved oxygen.
- Printing and Graphic Arts: Tristimulus colorimeters are used to calibrate computer monitors and printers, ensuring that the color seen on screen is faithfully reproduced on paper. They are also used for quality control of printed materials to maintain color consistency throughout a print run.
- Cosmetics: For products like foundation, lipstick, and eyeshadow, colorimeters ensure that the shade a customer buys is identical from one batch to the next, a crucial factor for brand loyalty.
A Practical Handbook for Colorimeter Users
Owning a high-quality colorimeter is only the first step. Achieving accurate, reliable, and repeatable measurements requires adherence to proper procedures for calibration, operation, and maintenance. Following these best practices will maximize the value of your instrument and ensure its longevity and performance.
The Foundation of Accuracy: Step-by-Step Calibration
Calibration is the process of setting the instrument to known standards, which corrects for any electronic drift and ensures its measurements are accurate and traceable. It should be performed regularly, typically at the start of each shift or whenever the instrument has been turned off.
General Procedure for Tristimulus Colorimeters
- Warm-Up: Turn the instrument on and allow it to warm up for at least 5-10 minutes. This allows the internal electronics and light source to stabilize.
- Clean Standards: Ensure the instrument’s calibration standards (typically a highly reflective white tile and a light-absorbing black trap or tile) are perfectly clean and free of dust, smudges, or scratches. Use a soft, lint-free cloth for cleaning.
- Perform Calibration: Following the manufacturer’s on-screen instructions, place the white tile over the measurement port and initiate the white calibration. This sets the top end of the measurement scale (100% reflectance). Then, if required, perform the black calibration using the black trap or tile to set the zero point of the scale.
Procedure for Photometric Colorimeters
- Prepare a Blank: Fill a clean, scratch-free cuvette with the pure solvent (e.g., distilled water) that was used to prepare your test solutions. This is the “blank”.
- Zero the Instrument: Place the blank cuvette into the colorimeter, ensuring it is correctly aligned with the light path. Press the “Calibrate,” “Zero,” or “Blank” button. The instrument will adjust itself so that the blank reads 0.000 absorbance (or 100% transmittance). This step subtracts the absorbance of the solvent itself, ensuring you only measure the absorbance of the solute.
- Create a Calibration Curve (if needed): For quantitative analysis, you must create a calibration curve by preparing a series of standard solutions with known concentrations. Measure the absorbance of each standard and plot the absorbance vs. concentration. This curve is then used to determine the concentration of unknown samples.
Best Practices for Reliable and Repeatable Measurements
- Stable Environment: Operate the instrument in a location with stable temperature and humidity, away from direct sunlight, drafts, and vibrations, as these can affect readings.
- Proper Sample Preparation: Samples must be clean, opaque (for reflectance measurements), and representative of the batch. Handle samples by their edges to avoid fingerprints or contamination on the measurement area.
- Consistent Sample Presentation: The way a sample is presented to the instrument must be consistent every time. Use a sample holder or jig whenever possible. For textured or non-uniform samples, it is best practice to take multiple measurements at different locations or orientations and average the results to get a more representative reading.
- Correct Cuvette Handling (for photometric analysis): Always use clean, unscratched cuvettes. Fill them to the proper level (typically two-thirds full). Wipe the outside with a lint-free cloth before placing it in the instrument, and always align the clear sides of the cuvette with the instrument’s light path, which is usually indicated by an arrow or mark.
Instrument Care: Maintenance for Longevity and Performance
- Regular Cleaning: Routinely clean the instrument’s exterior, display, and measurement port using a soft, lint-free cloth. Follow the manufacturer’s specific instructions for cleaning the delicate optical components. Never use harsh chemicals or abrasive materials.
- Proper Storage: When not in use, store the instrument in its protective case in a clean, dry, and stable environment to protect it from dust and impact.
- Battery Management (for portable units): Follow the manufacturer’s guidelines for charging. To preserve battery health during long-term storage, put the device into its “sleep” or “storage” mode.
- Annual Recertification: To comply with quality systems like ISO 9001 and to ensure the highest level of accuracy, it is recommended to have the instrument professionally serviced and recertified by the manufacturer or an authorized service center annually. This service verifies that the instrument’s performance is still within its original factory specifications.
From Data to Decisions: The Power of QC Software
In the modern laboratory and production environment, a color measurement instrument is only as powerful as the software that drives it. Quality control (QC) software transforms the raw numerical data from a colorimeter or spectrophotometer into a comprehensive data management platform, enabling deeper analysis, better communication, and more informed decision-making.
Key features of modern color QC software include:
- Advanced Data Display and Visualization: Software allows users to view color data in multiple formats simultaneously. This includes numerical data tables (L*a*b*, ΔE* values), graphical color plots (to visualize where a sample falls in color space relative to the standard), spectral curves (to identify metamerism with a spectrophotometer), and trend plots (to monitor color consistency over time).
- Flexible Tolerancing and Pass/Fail Assessment: Users can set specific, numerical pass/fail tolerances for each color standard. The software then provides clear, immediate visual indicators (e.g., green for “pass,” red for “fail”) for each measurement, removing ambiguity from the QC process.
- Centralized Database Management: All measurements are stored in a structured, searchable database, often organized by “jobs” or “products.” This creates a complete, traceable history of production quality that can be easily recalled for analysis, troubleshooting, or customer inquiries.
- Customizable Reporting: The ability to generate professional, customized reports is essential for both internal communication and for providing certificates of analysis to customers. Software allows users to design report templates that include only the specific data and graphs required.
- Regulatory Compliance: For regulated industries like pharmaceuticals and medical devices,FDA 21 CFR Part 11 is necessary.
Conclusion: Making an Informed Instrument Choice
Selecting the right color measurement instrument is a critical decision that impacts product quality, operational efficiency, and brand reputation. An informed choice requires moving beyond the simple name “colorimeter” and understanding the specific technology that aligns with your business goals. The selection process can be distilled into a logical sequence:
- Define Your Primary Task: First, determine whether your goal is analytical chemistry (measuring the concentration of a substance in a solution) or color quality control (measuring the color of a surface). This initial step will direct you to either a photometric colorimeter or a tristimulus colorimeter, respectively.
- Assess Your Operational Complexity and Risk: If your need is for surface color QC, the next step is to evaluate your operational environment. For straightforward process control—managing stable processes with known materials—a tristimulus colorimeter offers a fast, portable, and cost-effective solution. For comprehensive quality assurance—involving color formulation, managing a complex global supply chain, or mitigating the risk of costly failures like metamerism—an investment in a spectrophotometer is essential.
- Specify Your Application Needs: Finally, once the instrument type is chosen, you must select the correct configuration. This involves defining the optical geometry (45°/0° for appearance-based QC, or d/8° sphere for formulation and textured surfaces) and aperture size that are appropriate for the specific materials and products you will be measuring.
By following this structured approach, you empower yourself to select not just an instrument, but a complete solution tailored to your quality and production objectives. This knowledge transforms the purchasing process from a simple transaction into a strategic investment in precision, consistency, and confidence.
If you are ready to find the right Colorimeter for your laboratory, please browse our complete product range: Colorimeter
To understand the fundamental principles common to all types of spectrophotometers, be sure to read our main article: What Is a Spectrophotometer & How Does It Work? The Ultimate Guide.
Works cited
- The Importance of Food Color Measurement – HunterLab, https://www.hunterlab.com/blog/importance-of-food-color-measurement/
- (PDF) Application of Colorimetry in Food Industries – ResearchGate, https://www.researchgate.net/publication/375566936_Application_of_Colorimetry_in_Food_Industries
- Colorimeter (chemistry) – Wikipedia, https://en.wikipedia.org/wiki/Colorimeter_(chemistry)
- Food & Beverages | Color Control – Konica Minolta Sensing Americas, https://sensing.konicaminolta.us/us/industries/food-beverage-color-control/
- 2.4 COLORIMETRY – 2.Concepts – Language of Light | KONICA MINOLTA, https://www.konicaminolta.com/instruments/knowledge/light/concepts/07.html
- Photoelectric Tristimulus Colorimetry with Three Filters* – Optics Express, https://opg.optica.org/josa/fulltext.cfm?uri=josa-32-9-509-doi=10.1364/JOSA.32.000509
- Tristimulus colorimeter – Wikipedia, https://en.wikipedia.org/wiki/Tristimulus_colorimeter
- Applications of Colorimeters in Textile and Apparel Industry – GAO Tek Inc, https://gaotek.com/gaotek-news/applications-of-colorimeters-in-textile-and-apparel-industry/
- Color Measurement Testing As per standard ASTM E1347 – Kiyo R&D, https://www.kiyorndlab.com/color-measurement-testing-as-per-standard-astm-e1347/
- What are tristimulus values? Terms – NBchao.Com, https://en1.nbchao.com/w/1563/
- Let’s look at some color spaces.···I – Part I – Precise Color Communication – Konica Minolta, https://www.konicaminolta.com/instruments/knowledge/color/part1/07.html
- CIELAB color space – Wikipedia, https://en.wikipedia.org/wiki/CIELAB_color_space