The Definitive Guide to Atomic Absorption Spectrophotometer (AAS): Principles, Technologies, and Applications
Introduction to Atomic Absorption Spectrophotometry: The Gold Standard in Elemental Analysis
What is AAS and Why is it Essential?
|
|
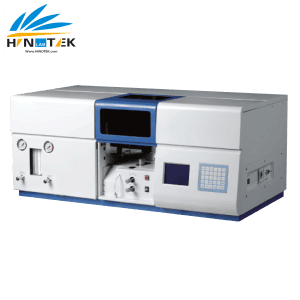
Atomic Absorption Spectrometer, commonly known as AAS, is a cornerstone analytical technique for the quantitative determination of chemical elements. For decades, it has been the trusted method in laboratories worldwide for measuring the concentration of over 70 different metals and metalloids. Its power lies in its exceptional sensitivity, capable of detecting elements at concentrations ranging from parts-per-million (ppm) down to parts-per-billion (ppb) and, with certain configurations, even parts-per-trillion (ppt) levels. This capability makes AAS an indispensable tool across a vast spectrum of industries, from environmental monitoring and food safety to clinical diagnostics and industrial quality control.
As a mature, robust, and relatively inexpensive technology, AAS provides a powerful combination of performance and ease of use. It is often the technique of choice for labs that require reliable, high-throughput, and uncomplicated trace elemental analysis, making it a workhorse instrument in thousands of analytical settings.
The Core Principle: How Atoms Absorb Light
The fundamental principle of atomic absorption spectroscopy is elegant and precise: free atoms of an element, when in their lowest energy state (the “ground state”), will absorb light of a very specific and characteristic wavelength. This process is unique to each element, forming the basis of the technique’s high selectivity.
The analysis unfolds in a series of steps:
- Atomization: The sample, typically in a liquid form, is introduced into the instrument and subjected to extremely high temperatures. This process, known as atomization, breaks down chemical compounds and converts the element of interest into a cloud of free, gaseous atoms in their ground state.
- Absorption: A specialized lamp, specific to the element being measured, shines a beam of light at the precise wavelength that the target atoms can absorb. As this light passes through the atom cloud, a portion of it is absorbed by the atoms.
- Excitation: The absorbed light energy excites the atoms, causing an electron to jump from its stable ground state to a higher, unstable energy level.
- Quantification: A detector on the other side of the atom cloud measures the initial intensity of the light (I0) and the reduced intensity of the light after it has passed through the sample (I). The amount of light absorbed is directly proportional to the number of atoms in the light path, and therefore, to the concentration of the element in the original sample.
This quantitative relationship is mathematically described by the Beer-Lambert Law, a foundational principle in spectrophotometry. The law is expressed by the equation:
A=ϵbc Where:
- A is the Absorbance (a logarithmic measure of the light absorbed).
- ϵ (epsilon) is the molar absorptivity, a constant unique to the element at that specific wavelength.
- b is the path length of the light through the atom cloud.
- c is the concentration of the analyte.
By measuring the absorbance (A) of a sample and comparing it to the absorbance of calibration standards with known concentrations, the unknown concentration of the element in the sample can be determined with high accuracy.
A Glimpse into the History: From Kirchhoff to Walsh’s Breakthrough
While the principles of spectroscopy have roots in the 19th century with the work of scientists like William Hyde Wollaston, Gustav Kirchhoff, and Robert Bunsen, who first observed absorption lines in the solar spectrum, modern atomic absorption spectroscopy is a more recent innovation. The technique as we know it today was pioneered in the 1950s by the brilliant Australian physicist Sir Alan Walsh.
At the time, the dominant method for elemental analysis was atomic emission spectroscopy, which measures the light given off by excited atoms. However, this technique was often plagued by inter-element interference and instability from the thermal sources used. Walsh, in what is now a famous “eureka moment,” realized that measuring atomic absorption would be inherently more stable and reliable. He reasoned that at the temperatures used in analysis, the vast majority of atoms remain in their ground state, ready to absorb light, rather than in an excited state capable of emitting it. This makes the absorption signal less sensitive to fluctuations in atomizer temperature, a major weakness of emission techniques.
Walsh and his team at the Commonwealth Scientific and Industrial Research Organisation (CSIRO) in Australia developed the first complete AAS instrument. It incorporated the three essential components that define modern systems: a sealed hollow cathode lamp as a sharp-line source, a flame atomizer to create the atomic vapor, and a tuned amplifier to process the signal. This breakthrough revolutionized chemical analysis, providing a method that was not only highly sensitive and specific but also far more robust and accessible than previous techniques. This historical context is vital; it demonstrates that AAS was conceived from the very beginning as a solution to the fundamental challenges of accuracy and interference that limited older methods, cementing its legacy as a reliable and trusted analytical tool.
The Anatomy of an AAS: A Look Inside the Technology
An Atomic Absorption Spectrophotometer is a sophisticated instrument, but its operation can be understood by examining its four primary components. Each part plays a critical role in the analytical pathway, from generating element-specific light to measuring its final absorption.
The Light Source: Element-Specific Illumination
The high selectivity of AAS begins with its light source. Unlike other forms of spectrophotometer (Such as HINOTEK UV-Visible Spectrophotometer) that use a broad-spectrum lamp, AAS employs a source that emits light at the specific wavelengths the target element can absorb.
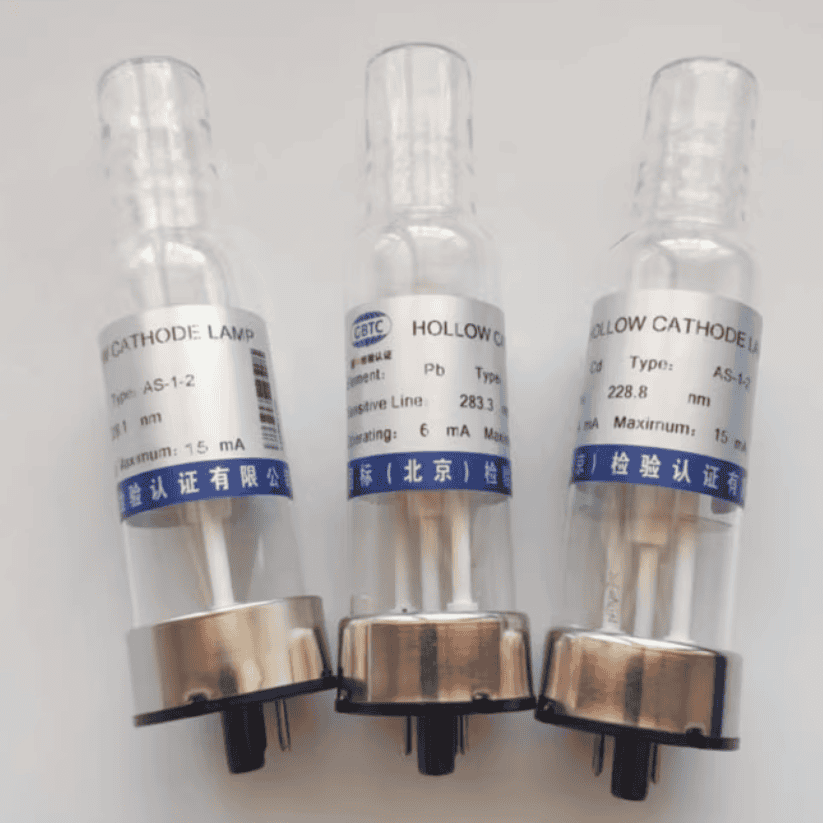 |
- Hollow Cathode Lamps (HCLs): The most common light source in AAS is the Hollow Cathode Lamp. An HCL is a sealed glass tube containing an anode, a cylindrical cathode, and an inert gas (typically neon or argon) at low pressure. The critical feature is that the cathode is fabricated from or lined with the pure element to be analyzed (e.g., a copper cathode for copper analysis). When a high voltage is applied, the inert gas is ionized. These positive ions are accelerated towards the cathode, striking its surface with enough energy to dislodge metal atoms in a process called “sputtering.” These sputtered atoms are then excited by collisions within the plasma and emit a sharp, intense, and nearly monochromatic light at the characteristic wavelengths of that specific element. This ensures that the light passing through the sample is perfectly matched to the absorption profile of the analyte, which is the foundation of the technique’s specificity. HINOTEK Atomic Absorption Spectrophotometer all use Hollow Cathode Lamps.
- Other Sources: For some elements, Electrodeless Discharge Lamps (EDLs) are used. They provide higher light intensity, which can be beneficial for volatile elements like arsenic and selenium, but often require longer warm-up times to stabilize. Additionally,
Deuterium Lamps are used not as an analytical source, but as a tool for background correction, a topic explored in detail in Section 4.
The design of modern AAS instruments often includes a multi-lamp turret that can hold four, six, or even eight HCLs simultaneously. This is a crucial feature for laboratories analyzing multiple elements, as it allows the instrument to automatically switch between lamps without manual intervention, significantly reducing downtime and improving workflow efficiency. This scalability is a key consideration for procurement, as it allows a lab to expand its analytical capabilities without purchasing a new instrument.
The Atomizer: Creating a Cloud of Free Atoms
|
|

The atomizer is the heart of the AAS, where the sample is converted from a liquid or solid into a cloud of free, ground-state atoms. This process, called atomization, is the most critical step in the analysis. The efficiency of atomization directly determines the sensitivity of the measurement. There are two primary types of atomizers used in modern AAS instruments: the flame and the graphite furnace. These will be compared in detail in the next section. The basic process within a flame atomizer involves three stages:
- Desolvation (Drying): The solvent is evaporated, leaving behind dry, fine particles of the sample.
- Vaporization: The solid particles are converted into a gaseous state.
- Atomization: The gaseous molecules are dissociated by the high heat into free, neutral atoms.
The Monochromator: Isolating the Analytical Wavelength
 |
Although the HCL produces a relatively pure spectrum, it still emits multiple characteristic lines for a given element. The monochromator’s job is to isolate the single, most sensitive analytical wavelength and reject all others, as well as any background light from the atomizer itself.
Light from the HCL enters the monochromator and strikes a diffraction grating. This is a finely ruled, mirrored surface that disperses the light into its component wavelengths, similar to how a prism separates white light into a rainbow. By precisely rotating the grating, only the desired analytical wavelength is directed through a narrow exit slit and onto the detector. This two-stage approach to selectivity—a highly specific source followed by a high-resolution monochromator—is what gives AAS its exceptional resistance to spectral interference from other elements in the sample.
The Detector: Measuring the Absorption
 |
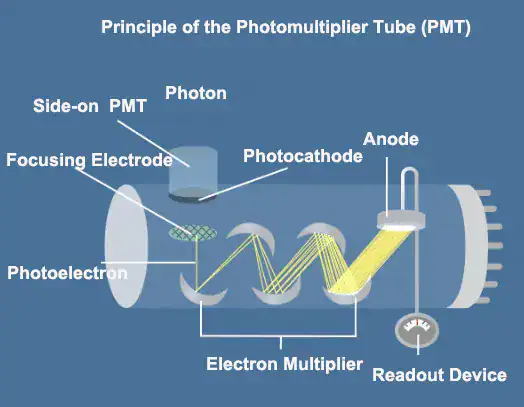 |
The final component in the optical path is the detector, which quantifies the amount of light that has been absorbed. The most common detector is the Photomultiplier Tube (PMT), an extremely sensitive device that converts light energy (photons) into a measurable electrical current.
The instrument’s electronics measure the PMT signal in two states: first, with a blank solution being aspirated to establish the initial light intensity (I0), and second, with the sample being aspirated, which gives the attenuated intensity (I). The instrument’s software then uses these values to calculate the absorbance. This digital signal is then processed to determine the element’s concentration based on the previously established calibration curve.
The Heart of the Matter: A Technical Comparison of Atomization Techniques
The choice of atomizer is the most significant decision in configuring an AAS system, as it dictates the instrument’s sensitivity, speed, cost, and suitability for different applications. The two primary technologies, Flame AAS and Graphite Furnace AAS, serve distinct analytical needs, and understanding their differences is crucial for any laboratory manager or procurement specialist.
Flame Atomic Absorption Spectroscopy (FAAS): The Robust Workhorse
Flame AAS is the original and most widely used atomization technique. In this method, a liquid sample is drawn up through a capillary tube into a nebulizer, which converts the liquid into a fine aerosol. This aerosol is mixed with a fuel (typically acetylene) and an oxidant (air or nitrous oxide) in a spray chamber before being introduced into a long, thin flame positioned in the light path.
The type of flame used depends on the element being analyzed:
- Air-Acetylene Flame: Reaching temperatures of approximately 2300°C, this is the most common flame and is suitable for analyzing about 35 elements, including common metals like copper, zinc, iron, and lead.
- Nitrous Oxide-Acetylene Flame: This hotter flame reaches about 2700°C and is necessary for atomizing refractory elements—those that tend to form stable oxides in the cooler air-acetylene flame, such as aluminum, silicon, vanadium, and titanium.
FAAS is valued for its speed, simplicity, and robustness. It provides rapid, continuous signals and is relatively tolerant of samples with high concentrations of dissolved solids. These attributes make it the ideal workhorse for high-throughput environments like industrial quality control, routine environmental screening, and applications where analyte concentrations are in the parts-per-million (ppm, or mg/L) range.
Graphite Furnace Atomic Absorption Spectroscopy (GFAAS): The Pinnacle of Sensitivity
Graphite Furnace AAS (also known as Electrothermal Atomization, or ETAAS) offers a dramatic increase in sensitivity compared to flame techniques. Instead of a flame, GFAAS uses a small, electrically heated graphite tube to atomize the sample. A tiny, precise volume of the sample (typically 5-50 microliters) is injected into the tube. The furnace then executes a pre-programmed, multi-stage temperature program, all under a flow of inert argon gas to prevent the tube from combusting.
A typical GFAAS program consists of three main stages:
- Drying: The temperature is raised gently (e.g., to 110-130°C) to slowly evaporate the solvent without sputtering the sample.
- Pyrolysis (Ashing): The temperature is increased significantly (e.g., to 300-1200°C) to thermally decompose the sample matrix. This step removes most of the interfering organic and inorganic components before the analysis step, leaving behind the more thermally stable analyte.
- Atomization: The temperature is rapidly ramped to a very high level (up to 3000°C) for a few seconds. This flash-heats the residue, instantly creating a dense, concentrated cloud of atoms directly in the light path.
This controlled, stepwise process provides two key advantages. First, it is far more efficient at converting the sample into free atoms than a flame. Second, the atoms are confined within the tube for a longer period, increasing the absorption signal. The result is a technique with sensitivity 100 to 1,000 times greater than FAAS, allowing for detection in the parts-per-billion (ppb, or µg/L) or even parts-per-trillion (ppt, or ng/L) range. This makes GFAAS essential for trace and ultra-trace analysis in clinical toxicology, environmental compliance testing, and high-purity materials research.
Table 1: FAAS vs. GFAAS — A Head-to-Head Comparison
For a technical buyer, the choice between FAAS and GFAAS represents a fundamental decision about a laboratory’s workflow, capabilities, and budget. The following table summarizes the key differences to guide this decision.
| Feature | Flame AAS (FAAS) | Graphite Furnace AAS (GFAAS) |
| Atomization Method | Nebulized sample aspirated into a continuous flame (e.g., air-acetylene) | Discrete sample volume heated in stages inside an electrically controlled graphite tube |
| Sensitivity / Detection Limits | Lower (mg/L or ppm range) | 100-1000x Higher (µg/L or ppb/ppt range) |
| Analysis Speed | Fast (typically 3-10 seconds per element per sample) | Slower (typically 2-3 minutes per sample due to the heating program) |
| Sample Volume Required | Larger (milliliters) | Very small (microliters) |
| Cost (Initial & Operational) | Lower initial instrument cost, lower operational cost (gases) | Higher initial instrument cost, higher operational cost (graphite tubes are consumables) |
| Matrix Interferences | More prone to chemical interferences in the complex flame environment | Fewer chemical interferences due to the controlled, inert environment and pyrolysis step |
| Typical Applications | Routine QC, high-concentration samples (e.g., major elements in alloys), initial environmental screening | Trace element analysis, clinical toxicology, environmental compliance monitoring, research, limited sample volumes |
| Element Limitations | Struggles with refractory elements (e.g., V, Mo, B) without a nitrous oxide flame | Excellent for most elements, but can struggle with carbide-forming elements (e.g., W, B) |
This comparison reveals a classic trade-off between throughput and sensitivity. FAAS is the choice for labs that need to process many samples quickly for analytes at higher concentrations. GFAAS is the solution for labs where the absolute lowest detection limits are required, and longer analysis times are acceptable. Recognizing this, many instrument manufacturers, including HINOTEK, offer combined systems that feature both a flame and a graphite furnace atomizer on a single platform. Such dual-system instruments provide the ultimate flexibility, allowing a single instrument to serve the diverse needs of a multi-purpose lab, such as a contract research organization or a university core facility. This represents a highly efficient use of both budget and bench space, offering a strategic solution to a common laboratory dilemma.
Specialized Techniques: Hydride Generation and Cold Vapor AAS
For a few specific elements that are difficult to analyze by conventional flame or furnace methods, specialized sample introduction accessories are available.
- Hydride Generation: This technique is used for elements that form volatile hydrides, most notably arsenic (As), selenium (Se), antimony (Sb), and bismuth (Bi). The sample is mixed with a chemical reducing agent (e.g., sodium borohydride), which converts the analyte into a gaseous hydride (AsH3, SeH2, etc.). This gas is then swept by a stream of argon out of the liquid matrix and into a heated quartz cell in the instrument’s light path, where it decomposes into free atoms. The key advantage is the highly efficient separation of the analyte from the sample matrix, which dramatically reduces interferences and improves detection limits.
- Cold Vapor: This technique is used exclusively for the analysis of mercury (Hg). Mercury is unique in that it has an appreciable vapor pressure at room temperature. In this method, mercury ions in the sample are chemically reduced to elemental mercury (Hg0). The resulting mercury vapor is then purged from the solution and passed through a quartz cell in the light path. No flame or furnace is required, hence the name “cold vapor.” This method is extremely sensitive and is the standard for mercury determination in environmental and clinical samples.
Ensuring Analytical Accuracy: Understanding Background Correction
While AAS is highly specific, one of the most significant challenges to achieving accurate results is background absorption. This phenomenon occurs when components of the sample matrix, other than the target analyte, absorb or scatter light from the source lamp. This non-specific absorption adds to the total measured absorbance, creating a falsely high signal and leading to inaccurate quantification.40 This is a particularly prevalent issue in GFAAS, where the atomization of a complex matrix can produce smoke and molecular species, and at the shorter UV wavelengths where many elements are measured.40 To obtain valid data, this background signal must be measured and subtracted from the total signal. Modern AAS instruments employ sophisticated techniques to accomplish this.
Deuterium (D2) Lamp Correction: The Classic Approach
Deuterium background correction is the oldest and most common method, particularly for flame AAS. It works by using two different light sources: the element-specific HCL and a deuterium (D2) arc lamp. The D2 lamp emits a broad, continuous spectrum of light across the UV range.
The instrument’s optical system rapidly alternates (or “chops”) between passing light from the HCL and the D2 lamp through the atomizer.
- The HCL measurement represents the total absorbance: the specific absorbance from the analyte atoms plus the non-specific background absorbance.
- The D2 lamp measurement represents only the background absorbance, as its broad emission is not significantly absorbed by the analyte’s sharp absorption line.
The instrument’s software then subtracts the D2 lamp signal from the HCL signal to yield the true, background-corrected analyte absorbance. While effective for many applications, this method has limitations. It is less accurate when correcting for high or rapidly changing background signals (“structured” background) and loses its effectiveness at wavelengths above approximately 320 nm, where the
D2 lamp’s energy output drops significantly.
Zeeman Effect Correction: The Superior Solution for Complex Matrices
For the most challenging samples and the highest accuracy, Zeeman effect background correction is the superior technique. It is based on a physical phenomenon where the absorption line of an atom splits into multiple components when placed in a strong magnetic field.
In a Zeeman AAS, a powerful magnet is placed around the atomizer (almost exclusively a graphite furnace). The instrument performs measurements by rapidly pulsing the magnetic field on and off.
- Magnet Off: The instrument measures the total absorbance (analyte + background) at the normal analytical wavelength.
- Magnet On: The magnetic field splits the analyte’s absorption line into a central component (π) and two side components (σ). A polarizer is used to block the central π component. The instrument then measures absorbance at the wavelength of the σ components. At these slightly shifted wavelengths, the analyte atoms do not absorb light, so this measurement represents the background absorption only.
The software then subtracts the “magnet on” (background) signal from the “magnet off” (total) signal. The crucial advantage of the Zeeman technique is that both the total and background measurements are performed using the exact same lamp and at wavelengths that are infinitesimally close to each other. This allows it to correct for virtually any type of background signal, including very high, structured, and rapidly changing backgrounds, with exceptional accuracy. This makes Zeeman correction the gold standard for GFAAS, especially when analyzing complex matrices like blood, urine, digested soils, or industrial effluents. This level of accuracy is often not just a preference but a requirement for producing legally defensible data in regulated industries.
Table 2: Deuterium vs. Zeeman Background Correction
The choice of background correction technology is a critical specification that directly impacts data quality and an instrument’s suitability for certain applications. This table provides a clear comparison for technical evaluation.
| Feature | Deuterium (D2) Correction | Zeeman Effect Correction |
| Mechanism | Uses a separate, broadband D2 lamp to measure the background signal, which is then subtracted from the HCL signal. | Uses a magnetic field to split the analyte’s absorption line; measures background and total signal using the same HCL. |
| Accuracy | Good for low, continuous background. Cannot accurately correct for structured or rapidly changing background signals. | Highly accurate. Corrects for virtually all types of background, including structured and high absorption (>1 Abs). |
| Wavelength Range | Effective only in the UV range (approximately 190-320 nm). | Effective across the entire AAS wavelength range (185-900 nm). |
| Typical Use Case | Standard for Flame AAS; sufficient for GFAAS with simple sample matrices. | The gold standard for Graphite Furnace AAS; essential for complex matrices (e.g., biological, environmental, metallurgical). |
| Strengths | Lower instrument cost, simple and fast implementation. | Superior accuracy and reliability, essential for trace analysis in challenging samples. |
| Limitations | Limited wavelength range, less accurate for complex backgrounds. | Higher instrument cost, can be subject to “rollover” effects at very high analyte concentrations. |
For laboratories with diverse needs, instruments that offer both correction methods provide maximum flexibility. For example, a lab could use the faster D2 correction for routine flame analysis and switch to the more powerful Zeeman correction for demanding graphite furnace applications, all on a single, versatile platform. This capability broadens an instrument’s utility and enhances its long-term value.
AAS in Action: Applications Across Key Industries
The versatility, sensitivity, and reliability of Atomic Absorption Spectrometry have made it an essential tool in countless fields. Its ability to provide precise elemental composition data is critical for scientific research, industrial quality control, and regulatory compliance.
Environmental Monitoring: Safeguarding Our Planet
AAS plays a pivotal role in environmental science by enabling the detection and quantification of toxic heavy metals and other pollutants. Regulatory bodies like the U.S. Environmental Protection Agency (EPA) and the World Health Organization (WHO) set strict limits for contaminants in the environment, and AAS is a primary technique used to ensure compliance.
- Water Quality Analysis: AAS is extensively used to monitor heavy metals such as lead (Pb), cadmium (Cd), mercury (Hg), and arsenic (As) in drinking water, groundwater, surface water, and industrial wastewater. GFAAS is particularly crucial for this application, as its low detection limits are necessary to meet the stringent regulatory standards for drinking water.
- Soil and Sediment Analysis: The technique helps identify and remediate contaminated land, such as former industrial sites or agricultural areas where pesticides have been used. It can measure the concentration of toxic metals in soil, sludge, and sediments, which is vital for assessing risks to agriculture and ecosystems.
- Air Pollution Monitoring: AAS can analyze airborne particulate matter collected on filters to determine the concentration of metals emitted from industrial sources, vehicle exhaust, and other combustion processes.
Food Safety and Agriculture: From Farm to Table
In the food and beverage industry, AAS is indispensable for ensuring product safety, quality, and accurate nutritional labeling. It is used to analyze a wide range of samples, from raw agricultural products to processed foods.
- Contaminant Testing: AAS is used to detect toxic heavy metals that can enter the food chain through contaminated soil, water, or processing equipment. Common analyses include testing for arsenic in rice, mercury in fish and seafood, and lead and cadmium in various food products and beverages.
- Nutritional Analysis: The technique is also used to measure the concentration of essential minerals and trace elements, such as iron (Fe), calcium (Ca), zinc (Zn), and copper (Cu). This data is critical for verifying the nutritional content of foods, especially for fortified products and infant formula, and for ensuring accurate labeling.
- Agricultural Applications: In agriculture, AAS is used to analyze soil and plant tissues to optimize fertilizer use, diagnose nutrient deficiencies, and monitor the uptake of elements from the soil.
Clinical Diagnostics and Toxicology: Insights into Human Health
In the medical field, the analysis of trace elements in biological fluids provides critical information for diagnosing diseases, monitoring patient health, and assessing exposure to toxic substances. Due to the small sample volumes and the very low concentrations of many elements in biological matrices, Graphite Furnace AAS (GFAAS) is the predominant technique in this area.
- Toxicology: GFAAS is the standard method for measuring levels of toxic metals like lead and cadmium in whole blood to diagnose poisoning, particularly in children and occupationally exposed adults. It is also used to measure mercury in blood and urine.
- Nutritional and Metabolic Assessment: The technique is used to determine concentrations of essential trace elements such as zinc, copper, and selenium in blood serum or plasma. Deficiencies or excesses of these elements can be indicative of various metabolic disorders, nutritional deficiencies, or diseases. This information is vital for guiding therapeutic interventions and monitoring treatment efficacy.
Industrial Quality Control: Metallurgy, Mining, and Manufacturing
AAS is a workhorse in industrial settings for quality assurance and quality control (QA/QC), ensuring that materials meet precise compositional specifications.
- Metallurgy and Alloy Analysis: In the metals industry, AAS is used to verify the composition of alloys. The presence and concentration of alloying elements like chromium, nickel, manganese, and copper in steel and other alloys determine their physical properties, such as hardness, strength, and corrosion resistance. AAS provides a rapid and accurate way to confirm that these materials meet grade specifications.
- Mining and Geochemical Analysis: In mining operations, AAS is used to analyze ore samples to determine the concentration of valuable metals like gold, silver, and copper. This process, known as ore grade assessment, is crucial for determining the economic viability of a mining site and for optimizing extraction processes.
- Raw Material Testing: In manufacturing, AAS is used to check the purity of raw materials and to detect elemental impurities that could compromise the quality or safety of the final product, from pharmaceuticals to semiconductors.
Across these diverse fields, the common thread is the need for accurate, reliable, and often legally defensible data. AAS provides a proven and cost-effective solution to this universal requirement, making it one of the most widely applied analytical techniques in the world.
The Buyer’s Guide: How to Choose the Right AAS for Your Laboratory
Selecting the right Atomic Absorption Spectrophotometer is a significant capital investment that requires careful consideration of your laboratory’s specific analytical requirements, workflow, and budget. This guide provides a systematic framework to help you make an informed decision.
Assessing Your Core Analytical Needs
Before evaluating specific models, you must first define your needs. Answering the following questions will narrow down your options significantly.
- What elements will you analyze, and at what concentration levels? This is the most critical question. If you are measuring major or minor components in the parts-per-million (ppm) range (e.g., copper in brass, calcium in water), a Flame AAS (FAAS) is likely sufficient and more cost-effective. If you need to detect trace or ultra-trace contaminants in the parts-per-billion (ppb) range (e.g., lead in drinking water, cadmium in blood), a Graphite Furnace AAS (GFAAS) is essential.
- What is the nature of your sample matrix? Are your samples relatively clean, like drinking water, or are they complex and “dirty,” like digested soil, wastewater, or biological fluids? Complex matrices generate high background signals and require a more powerful background correction system, making Zeeman correction a necessity for accurate results.
- What is your required sample throughput? How many samples do you need to analyze per day or week? FAAS is inherently faster and better suited for high-throughput environments. For any significant sample load, an autosampler is a crucial accessory that enables unattended operation, freeing up valuable analyst time and improving reproducibility.
- What are your budget and operator expertise? Consider the total cost of ownership, which includes the initial purchase price, ongoing operational costs (gases, lamps, graphite tubes), and maintenance. FAAS systems have a lower initial and operational cost. GFAAS systems are more expensive to purchase and maintain. Also, consider the skill level of your staff; modern instruments with user-friendly software and pre-loaded “cookbook” methods can significantly reduce the training curve for new operators.
Key Specifications to Consider
Once you have defined your needs, you can compare the technical specifications of different instruments.
- Optical System (Single vs. Double Beam): A double-beam optical system splits the light from the HCL into two paths: one that goes through the sample and one that bypasses it (the reference beam). The instrument’s electronics compare the two beams in real-time. This design automatically compensates for any fluctuations or drift in the lamp’s intensity, resulting in a more stable baseline and better long-term precision. For analyses requiring high stability, a double-beam system is strongly recommended.
- Wavelength Range: A typical AAS has a wavelength range of approximately 185-900 nm, which covers the analytical lines for all elements measurable by the technique. Ensure the instrument you choose covers the full range needed for your applications.
- Lamp Capacity: A motorized, multi-lamp turret is a key automation feature. An instrument that can hold 6 or 8 lamps allows you to set up a multi-element analysis and have the instrument run it automatically, switching lamps as needed. This is a major time-saver compared to manually changing and aligning a lamp for each new element.
- Safety Features: For any instrument using a flame, safety is paramount. Look for systems with fully automated gas controls, software-based safety interlocks that check for correct burner head, proper drain function, and flame status, and sensors that can detect gas leaks. These features are critical for protecting both the operator and the laboratory.
Table 3: AAS Selection Checklist for Technical Buyers
Use this checklist to systematically evaluate your laboratory’s needs and match them to the appropriate instrument features.
| Consideration | My Laboratory’s Requirement (e.g., Analytes, Volume, Budget) | Key AAS Feature to Look For |
| Primary Analytes | e.g., Cu, Zn, Fe in alloys | Standard Flame (FAAS) |
| e.g., Pb, Cd in wastewater | Graphite Furnace (GFAAS) | |
| e.g., As, Se, Hg | Hydride Generation / Cold Vapor Accessory | |
| Required Detection Limit | ppm (mg/L) | Flame AAS (FAAS) |
| ppb (µg/L) or lower | Graphite Furnace AAS (GFAAS) | |
| Sample Matrix Complexity | Low (e.g., clean water, simple solutions) | Deuterium (D2) Background Correction |
| High (e.g., blood, soil digest, high salts) | Zeeman Background Correction | |
| Sample Throughput | >100 samples/day | Autosampler, Fast Analysis Modes |
| <20 samples/day | Manual operation may be sufficient | |
| Available Sample Volume | Ample (> 5 mL per analysis) | Flame AAS (FAAS) |
| Limited (< 1 mL available) | Graphite Furnace AAS (GFAAS) | |
| Operator Skill Level | Beginner / Routine Use | User-friendly software with “cookbook” methods |
| Expert / Method Development | Advanced software with full parameter control | |
| Budget (Total Cost of Ownership) | Economy-focused | Flame-only system, D2 correction |
| Performance-focused | Combined Flame/Furnace system, Zeeman correction |
Introducing the HINOTEK SP-AA1800: A Versatile and Powerful Solution
The HINOTEK SP-AA1800 Atomic Absorption Spectrophotometer is engineered to meet the diverse needs of the modern analytical laboratory. It is a versatile platform that combines high-performance components with advanced automation, making it an ideal solution for a wide range of applications. By offering a powerful combination of features found across top-tier brands, the SP-AA1800 represents a smart, consolidated investment.
Key features that address the needs outlined above include:
- Maximum Versatility: The SP-AA1800 is a dual-system instrument, equipped with both a high-efficiency Flame system and a high-sensitivity Graphite Furnace system. This allows a single instrument to handle everything from routine QC to ultra-trace research.
- Advanced Automation: An automatic, six-lamp turret allows for seamless, unattended multi-element analysis. The fully automated gas control system and automatic ignition ensure safe and reproducible flame operation. An optional graphite furnace autosampler further enhances productivity.
- Superior Performance: The fully enclosed optical system features a high-dispersion 1800 line/mm grating, ensuring excellent resolution. The instrument delivers outstanding sensitivity, with a characteristic concentration for copper of 0.015 µg/mL/1% and a detection limit of 0.002 µg/mL.
- Comprehensive Background Correction: The SP-AA1800 comes standard with both Deuterium lamp and self-absorbing background correction methods, providing the flexibility to choose the optimal correction for any application.
Table 4: HINOTEK SP-AA1800 Technical Specifications
The following table provides a summary of the key technical specifications for the HINOTEK SP-AA1800, demonstrating its capabilities as a high-performance analytical instrument.
| Parameter | Specification |
| Optical System | Fully enclosed, double beam |
| Wavelength Range | 190-900 nm |
| Monochromator | Czerny-Turner type with 1800 line/mm grating |
| Spectral Bandwidth | 0.1, 0.2, 0.4, 1.0, 2.0 nm (Auto Set) |
| Lamp Holder | 6-lamp automatic switching turret |
| Background Correction | Deuterium lamp and Self-priming background correction |
| Flame System | All-titanium burner head (50 mm or 100 mm) |
| Characteristic Concentration (Cu) | |
| Detection Limit (Cu) | |
| Precision (RSD) | |
| Graphite Furnace System | Longitudinal heating with optical temperature control |
| Temperature Range | |
| Characteristic Quantity (Cd) | |
| Detection Limit (Cd) | |
| Precision (RSD) | |
| Data Processing | Standard curve, standard addition, automatic fitting |
| Autosampler (Optional) | 130-position sample tray |
A Brief Overview of the Competitive Landscape
The Atomic Absorption Spectrometry market is mature and led by several key global manufacturers, each with distinct technological strengths and market positions. Understanding this landscape provides valuable context for evaluating any AAS instrument.
Market Leaders and Their Technologies
The market is primarily dominated by a few well-established players. Each has developed proprietary technologies and focuses on specific aspects of performance to differentiate their offerings.
- Agilent Technologies: Agilent is well-known for its “Fast Sequential” (FS) flame technology, which is designed to dramatically increase sample throughput by measuring all elements in a single sample aspiration, mimicking the speed of an ICP system for multi-element analysis. Their Zeeman GFAAS systems are also highly regarded for their sensitivity.
- PerkinElmer: As a historical pioneer in AAS, PerkinElmer emphasizes robustness and reliability with its PinAAcle series of instruments. They are known for their rugged designs, capable of withstanding corrosive environments, and their long-standing, user-friendly WinLab32 software platform.
- Thermo Fisher Scientific: Thermo Fisher’s iCE 3000 series focuses on flexibility and performance. They offer a range of configurations, including dedicated flame, dedicated furnace, and unique dual-atomizer systems that allow for true simultaneous operation, all controlled by their wizard-driven SOLAAR software.
- Shimadzu: Shimadzu’s AA-7800 series emphasizes safety, ease of use, and a compact footprint. They incorporate advanced safety features like automatic gas leak checks and vibration sensors as standard. Their WizAArd software is designed to be intuitive for beginners, and they are noted for producing some of the smallest dual-system instruments on the market.
This competitive analysis reveals that each major brand has carved out a strategic niche: Agilent targets speed, PerkinElmer focuses on robustness, Thermo Fisher offers flexibility, and Shimadzu prioritizes safety and compactness. This context is useful for positioning the HINOTEK SP-AA1800, which integrates many of these key strengths—flexibility, automation, and high performance—into a single, comprehensive platform, offering an excellent balance of features and value.
Maximizing Your Investment: Operation, Maintenance, and Troubleshooting
Proper operation and routine maintenance are essential for ensuring the long-term performance, accuracy, and reliability of your Atomic Absorption Spectrophotometer. A proactive approach to instrument care will minimize downtime, reduce operational costs, and produce higher quality data.
Best Practices for Instrument Calibration
Accurate quantification is impossible without proper calibration. This process should be performed at the beginning of every analytical run.
- Standard Preparation: Prepare a blank and a series of at least three to five calibration standards of known concentrations from a certified stock solution. The standards should bracket the expected concentration range of your samples. Use the same acid matrix for your standards and your samples to minimize matrix effects.
- Calibration Curve: Operate the instrument according to the standard operating procedure. Aspirate the blank to set the zero point, then aspirate the standards in order of increasing concentration. The instrument’s software will measure the absorbance of each standard and plot it against its concentration to generate a calibration curve.
- Verification: A good calibration curve should be linear, with a correlation coefficient (R2) of 0.995 or better. After calibration, it is good practice to analyze a quality control (QC) sample with a known concentration to verify the accuracy of the curve. If the QC sample result is not within acceptable limits, the instrument should be recalibrated.
- Standard Addition: For samples with very complex or unknown matrices that interfere with the analysis, the method of standard addition can be used. This involves adding known spikes of the analyte directly to aliquots of the sample itself to create the calibration curve, effectively matching the matrix of the standards to the sample.
Table 5: Recommended AAS Maintenance Schedule
Following a regular maintenance schedule is the most effective way to prevent problems and ensure instrument longevity. This checklist consolidates best practices for both flame and graphite furnace systems.
| Frequency | Task | Rationale |
| Daily (Before/After Use) | Empty waste container. | Prevents overflow, hazardous spills, and back-pressure on the nebulizer. |
| Check gas cylinder pressures (Acetylene must be >700 kPa / 100 psi). | Ensures a stable flame and prevents acetone carryover from the cylinder, which can cause an unstable, noisy signal. | |
| Check exhaust system is functioning properly. | Critical for operator safety to remove toxic fumes and heat from the laboratory. | |
| Clean burner compartment and instrument exterior of any spills. | Prevents corrosion of instrument components and sample cross-contamination. | |
| Aspirate deionized water or a blank solution for several minutes after analysis (Flame). | Thoroughly flushes the nebulizer, spray chamber, and burner to prevent clogging from salt buildup. | |
| Weekly | Check nebulizer uptake rate by timing the aspiration of a known volume. | A significant drop in the uptake rate is a clear indicator of a partial clog in the nebulizer or capillary tubing. |
| Inspect and clean the burner head slot (Flame). | Removes carbon and salt deposits that can distort the flame shape, reducing sensitivity and precision. | |
| Inspect autosampler tubing and probe for wear or blockages. | Ensures accurate and reproducible sample delivery. | |
| Monthly / Periodically | Inspect and clean the spray chamber and impact bead (Flame). | Ensures proper aerosol generation. A pitted or damaged impact bead will degrade sensitivity and should be replaced. |
| Check all O-rings in the atomization system for signs of wear, cracking, or degradation. | Damaged O-rings can cause gas leaks, leading to an unstable flame and unsafe operating conditions. | |
| Perform a gas leak check on all fittings and connections. | A critical safety procedure to prevent the release of flammable or oxidizing gases. | |
| Replace graphite tubes as needed (Graphite Furnace). | Graphite tubes are consumables with a finite lifetime. Their performance degrades with use, leading to poor sensitivity and precision. |
Troubleshooting Common Issues: A Practical Guide
Even with proper maintenance, issues can arise. This guide addresses some of the most common problems and their likely causes.
- Problem: Low Sensitivity / Poor Signal
- Check Alignment: Ensure the hollow cathode lamp and the atomizer (burner or graphite furnace) are correctly aligned in the optical path.
- Check Nebulizer (FAAS): A partially clogged nebulizer is a very common cause of low sensitivity. Check the uptake rate and clean if necessary. Also, check the impact bead position.
- Check Flame Conditions (FAAS): Optimize the fuel/oxidant ratio. An incorrect flame stoichiometry can drastically reduce the free atom population.
- Check Furnace Program (GFAAS): Ensure the ashing and atomization temperatures are optimized for the analyte and matrix. An incorrect program can lead to premature loss of the analyte or incomplete atomization.
- Check Lamp: The HCL may be nearing the end of its life. Check its energy output in the software diagnostics.
- Problem: Poor Precision (High Relative Standard Deviation – RSD)
- Unstable Flame (FAAS): Check for fluctuations in gas pressures, a dirty burner head, or an improperly set drain loop, all of which can cause the flame to flicker.
- Inconsistent Aspiration (FAAS): Ensure the sample capillary tube is fully immersed in the sample and that there are no air bubbles being drawn into the line.
- Autosampler Issues (GFAAS): Check for air bubbles in the syringe or a dirty/clogged dispensing capillary. Ensure the injection depth is set correctly so the sample is deposited properly inside the graphite tube.
- Worn Graphite Tube (GFAAS): An old or degraded graphite tube will give poor reproducibility. Replace the tube.
- Problem: Flame Won’t Ignite or is Unstable
- Check Gas Supplies: Confirm that the main cylinder valves are open and that there is sufficient pressure in both the fuel and oxidant cylinders.
- Check Drain/Liquid Trap: The drain interlock is a key safety feature. Ensure the U-tube or liquid trap is filled to the correct level and that the drain tube is not kinked or submerged in the waste container.
- Check for Leaks: Ensure the burner head is seated correctly and that there are no gas leaks from the nebulizer or spray chamber fittings.
The Future of AAS and Concluding Remarks
Summary of AAS Strengths
For over half a century, Atomic Absorption Spectrometry has remained a vital and widely trusted technique in analytical chemistry. Its enduring relevance is a testament to its fundamental strengths:
- High Specificity: By using element-specific light sources, AAS offers excellent selectivity with minimal spectral interference.
- Excellent Sensitivity: With graphite furnace technology, AAS can achieve detection limits in the sub-ppb range, rivaling more expensive techniques for many applications.
- Versatility: The technique can handle a diverse range of sample types across countless industries, from environmental monitoring to clinical analysis.
- Cost-Effectiveness: Compared to multi-element techniques like Inductively Coupled Plasma (ICP), AAS offers a significantly lower initial investment and reduced operational costs, making it accessible to laboratories with varying budgets.
- Robustness and Reliability: AAS is a mature, well-understood technology with straightforward operation, making it a reliable workhorse for routine analysis.
While its primary limitation is its single-element nature, this can also be an advantage. For laboratories that need to analyze for one or a few specific elements, AAS is often faster and more direct than setting up a multi-element run on an ICP system. It remains the ideal tool for targeted, quantitative elemental analysis.
Partnering with HINOTEK for Your Elemental Analysis Needs
Choosing an analytical instrument is more than a simple purchase; it is an investment in your laboratory’s capabilities, productivity, and future. At HINOTEK, we understand the complex challenges faced by modern laboratories, from meeting stringent regulatory requirements to maximizing analytical throughput on a limited budget.
This guide has been designed to provide the comprehensive, expert-level information that technical decision-makers require. It reflects our commitment not just to providing high-performance instrumentation, but also to serving as a knowledgeable partner for our clients. The HINOTEK SP-AA1800 embodies this philosophy, offering a versatile, powerful, and automated platform that integrates the capabilities of both flame and graphite furnace AAS into a single, cost-effective system.
We invite you to contact our team of technical specialists to discuss your specific applications. We are confident that we can provide an elemental analysis solution that meets your performance requirements and delivers an exceptional return on your investment.