 |
1. Defining HPLC: A Foundational Analytical Technique
High-Performance Liquid Chromatography (HPLC) (View HINOTEK complete HPLC catalog) is an analytical chemistry technique used to separate, identify, and quantify specific components within a mixture. It is a method for analyzing liquid solutions that may contain pharmaceuticals, food products, chemicals, biological samples, or environmental pollutants.
HPLC evolved from traditional liquid chromatography (LC). In traditional LC, a solvent (the mobile phase) moves through a column by the force of gravity. This process is slow and often results in an inefficient separation.
The primary difference with HPLC is the use of high-pressure pumps. The technique was formerly known as High-Pressure Liquid Chromatography. The pumps force the mobile phase and sample through a column packed with a stationary phase. This high pressure is not the goal itself. It is the means to an end.
The high pressure allows for the use of columns packed with much smaller particles. These small particles (typically 3 µm to 5 µm in diameter) create a large surface area for interactions, leading to vastly improved separation efficiency and higher resolution. This ability to achieve superior results is why the “P” in HPLC is now universally understood to mean “Performance.”
2. The Core Principle: How HPLC Separation Works
The fundamental principle of HPLC separation is selective retardation or differential partitioning.
Every HPLC system consists of two primary phases:
- Mobile Phase: A liquid solvent or mixture of solvents (e.g., water, acetonitrile, methanol) that carries the sample through the system.
- Stationary Phase: A solid, porous material packed inside the column (e.g., silica particles).
Here is how the separation process works:
- A small, precise volume of the sample mixture is injected into the mobile phase stream.
- The high-pressure pump pushes the mobile phase (containing the sample) through the column.
- Inside the column, a competition begins. Each component (analyte) in the sample mixture interacts with both the mobile phase and the stationary phase.
- These interactions are physical in nature, such as hydrophobic, dipole-dipole, or ionic.
- Components that interact more strongly with the stationary phase are retarded. They move more slowly through the column.
- Components that interact weakly with the stationary phase (or are more soluble in the mobile phase) move faster.
Because each component in the mixture has different chemical properties, each moves at a different speed. This differential migration results in the components separating as they travel through the column.
The separated components exit the column one by one and pass into a detector. The detector records the signal of each component over time. This output is a graph called a chromatogram, where each separated component is represented as a “peak”.
This principle is not passive; it is actively controlled by the analyst. By changing the composition of the mobile phase (e.g., its solvent ratio or pH), the operator can influence the interactions and thus control the separation.
3. Anatomy of an HPLC System: A Component-by-Component Breakdown
An HPLC is a modular system. Each component must work correctly for the analysis to be successful. The path of flow generally follows this order: reservoir, degasser, pump, injector, column, detector, and data system.
3.1 Solvent Reservoir and Degasser
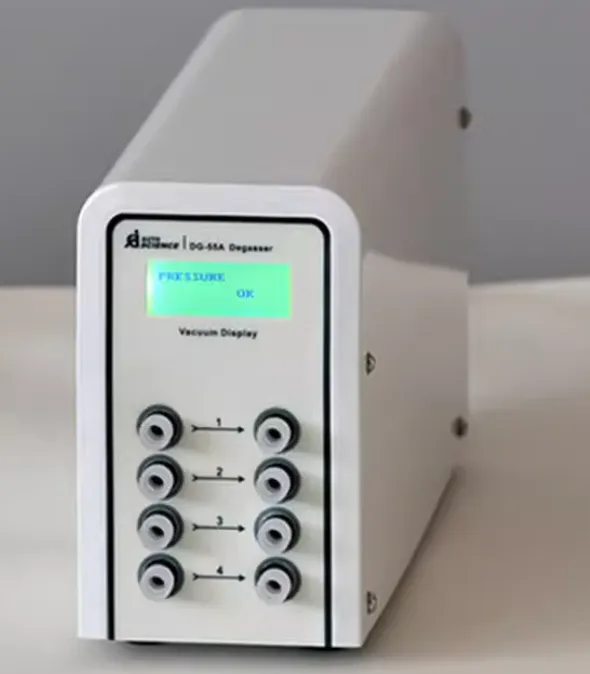 |
The solvent reservoir is the bottle that holds the mobile phase solvents. Before the solvent reaches the pump, it must be degassed.
Liquid solvents in contact with the atmosphere naturally dissolve air. When the pressure changes rapidly (as in a pump), this dissolved gas can form bubbles. Bubbles in the pump cause an unstable, pulsating flow. Bubbles in the detector flow cell cause spurious peaks and high baseline noise, making accurate detection impossible.
To prevent this, nearly all modern HPLC systems use an inline vacuum degasser. This module passes the solvent through gas-permeable tubing inside a vacuum chamber, efficiently pulling dissolved gases out of the liquid before it enters the pump.
3.2 The Pump: The Engine of the System
The pump’s function is to deliver the mobile phase at a precise, constant, and pulseless flow rate. A stable flow rate is critical for reproducible results. Most modern pumps use a reciprocating dual-piston design, where one piston delivers flow while the other aspirates, minimizing flow pulsation.
Pumps are used to perform two primary types of elution:
- Isocratic Elution: The composition of the mobile phase remains constant throughout the entire analysis (e.g., a pre-mixed 60% methanol / 40% water solution). This is ideal for simple, routine analyses where the components have similar chemical properties.
- Gradient Elution: The composition of the mobile phase changes over time during the analysis. For example, the run might start at 10% acetonitrile and linearly increase to 90% acetonitrile. This is essential for separating complex mixtures containing components with a wide range of polarities.
3.3 Pump Hardware: Binary vs. Quaternary
The choice of pump hardware dictates how a gradient elution is performed. This is a primary decision for a laboratory purchasing a new system.
- Binary Pump (High-Pressure Gradient – HPG):
- Structure: This system uses two separate high-pressure pumps. Pump A delivers Solvent A, and Pump B delivers Solvent B.
- Mixing: The two solvent streams are combined after the pumps, in a high-pressure mixing chamber.
- Application: Binary pumps are excellent for routine, high-throughput applications that require a precise two-solvent gradient (e.g., water and acetonitrile). They are often preferred in quality control (QC) labs.
- Quaternary Pump (Low-Pressure Gradient – LPG):
- Structure: This system uses only one high-pressure pump.
- Mixing: Before the pump, a proportioning valve opens and closes rapidly, drawing specific volumes from up to four different solvent reservoirs (A, B, C, D). This mixing occurs at low pressure (on the suction side of the pump).
- Application: Quaternary pumps offer maximum flexibility. They are the standard for method development laboratories, where researchers need to test different solvent combinations, buffers, or pH modifiers to find the best separation conditions.
3.4 The Injector: Introducing the Sample
The injector’s job is to introduce a precise volume of the sample into the high-pressure mobile phase stream.
- Manual Injector:
- Pros: Low cost. Suitable for academic teaching labs or applications where high precision is not required.
- Cons: Reproducibility is highly dependent on operator skill. It is easy to introduce errors like incomplete loop filling or air bubbles. This method is not suitable for rigorous quantitative analysis.
- Autosampler (Automatic Injector):
- Pros: Provides automated, high-precision, and accurate injections. This reduces manual labor and allows for unattended, high-throughput analysis (e.g., running 96 samples overnight).
- Application: For quantitative analysis, an autosampler is an absolute priority. In any regulated laboratory environment (e.g., pharmaceutical GMP or clinical diagnostics), an autosampler is required for data integrity and reproducibility.
3.5 The Column and Guard Column
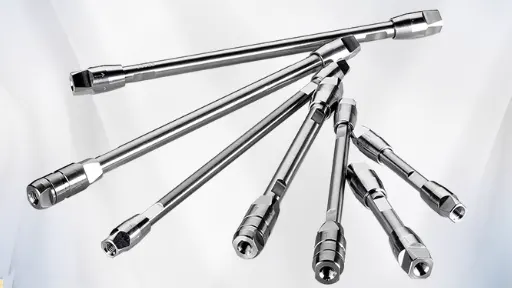 |
- Analytical Column: This is the “heart” of the HPLC system where the actual separation occurs. It is a stainless steel tube packed tightly with the stationary phase particles. (See Section 4 for details).
- Guard Column (Pre-column):
- Structure: A short, inexpensive “sacrificial” column installed between the injector and the analytical column.
- Function: The guard column is packed with the same material as the analytical column. It captures particulates and strongly retained contaminants from the sample matrix. This prevents the contaminants from clogging or irreversibly binding to the main analytical column, thereby extending its lifetime. This is a simple, cost-effective way to protect a much more expensive investment.
3.6 Detector and Data System
- Detector: As the separated components elute from the column, they pass through the detector. The detector measures a physical or chemical property of the components and converts it into an electrical signal. (See Section 6 for details).
- Data System: A computer and specialized software (Chromatography Data System, or CDS) that receives the signal from the detector. The CDS converts this signal into the visual chromatogram, integrates the peaks, and performs calculations for identification and quantification.
4. In-Depth Focus: Understanding HPLC Columns
The column is the most critical consumable in the system. Its physical parameters and chemical makeup (stationary phase) determine the quality of the separation.
4.1 Key Physical Parameters and Their Impact
- Particle Size (dp):
- Definition: The average diameter of the stationary phase particles, measured in micrometers (µm). Standard HPLC columns typically use 3 µm or 5 µm particles.
- Impact: Smaller particles provide a larger surface area and a more uniform packing. This increases separation efficiency (N) , resulting in sharper, narrower peaks and better resolution.
- The Trade-off: System backpressure. Backpressure is inversely proportional to the square of the particle size. As a result, halving the particle size (e.g., from 5 µm to 2.5 µm) will increase the system pressure approximately fourfold. The HPLC system’s pump must be capable of handling this pressure.
- Pore Size:
- Definition: The size of the pores within the stationary phase particles, measured in angstroms (Å).
- Impact: The analyte must be able to access the pores to interact with the stationary phase surface area inside.
- Selection Rule :
- Small Molecules (MW < 2,000 Da): Use standard pore sizes (e.g., 80–120 Å).
- Large Molecules (Proteins, Peptides; MW > 2,000 Da): Must use wide-pore columns (e.g., 300 Å or larger).
- If a large protein is injected onto a small-pore column, it cannot enter the pores and will not be retained. It will pass straight through the column without being separated.
- Column Length (L):
- Definition: The length of the column, typically 50 mm, 100 mm, 150 mm, or 250 mm.
- Impact: Doubling the column length generally doubles the resolution and the analysis time, while also doubling the backpressure. Shorter columns (e.g., 50 mm) are used for fast analyses where high resolution is not the primary goal.
- Internal Diameter (ID):
- Definition: The inner diameter of the column tube. The standard analytical ID is 4.6 mm.
- Impact: Smaller “narrow-bore” (e.g., 2.1 mm ID) columns are common.
- Benefit 1 (Solvent Savings): They use lower flow rates, reducing solvent consumption.
- Benefit 2 (Sensitivity): They increase analytical sensitivity. For the same injected sample amount, a 2.1 mm ID column will produce peaks that are approximately four times higher than a 4.6 mm ID column. This is critical for trace analysis or when interfacing with a Mass Spectrometer (LC-MS).
4.2 Common Stationary Phase Chemistries
This refers to the chemical coating bonded to the silica particles.
- C18 (Octadecylsilane):
- Structure: A 18-carbon alkyl chain (C18) bonded to the silica surface.
- Properties: This phase is highly non-polar (hydrophobic). It is the most versatile and widely used stationary phase, often called the “workhorse” of HPLC. It offers high retention for a broad range of non-polar and moderately polar compounds.
- C8 (Octylsilane):
- Structure: An 8-carbon alkyl chain (C8) bonded to the silica.
- Properties: This phase is also non-polar, but it is less hydrophobic and less retentive than a C18 column.
- Application: A C8 column is used when analytes are too strongly retained on a C18 column (i.e., the analysis time is too long). It is also often a good choice for the analysis of larger molecules like peptides.
5. HPLC Separation Modes: Choosing the Right Technique
HPLC is not a single method but a family of techniques. The “mode” is chosen based on the chemical properties of the analytes to be separated.
5.1 Reversed-Phase (RP-HPLC)
This is the most common mode of HPLC, used for over 80% of all small-molecule separations.
- Stationary Phase: Non-polar (hydrophobic), such as C18 or C8.
- Mobile Phase: Polar (hydrophilic), typically a mixture of water with acetonitrile or methanol.
- Separation Principle: Hydrophobicity.
- Elution Order: More polar components interact weakly and elute first. More non-polar (hydrophobic) components interact strongly and elute last.
5.2 Normal-Phase (NP-HPLC)
This is the “classic” mode of chromatography and is the opposite of reversed-phase.
- Stationary Phase: Polar (hydrophilic), such as bare silica.
- Mobile Phase: Non-polar (hydrophobic), such as hexane or other organic solvents.
- Separation Principle: Polarity.
- Elution Order: More non-polar components elute first. More polar components interact strongly with the polar silica and elute last.
5.3 Ion-Exchange Chromatography (IEX)
This mode separates molecules based on their net surface charge.
- Stationary Phase: Contains fixed ionic groups (either positive, for an anion exchanger, or negative, for a cation exchanger).
- Mobile Phase: An aqueous buffer.
- Separation Principle: Electrostatic interactions. Analytes with an opposite charge bind to the stationary phase.
- Elution: Elution is achieved by changing the mobile phase’s pH (which changes the analyte’s charge) or by increasing the salt concentration (ionic strength), which shields the charges and releases the analytes.
- Application: Ideal for charged molecules like proteins, peptides, and nucleic acids.
5.4 Size-Exclusion Chromatography (SEC)
Also known as Gel Permeation Chromatography (GPC), this mode separates molecules based on their physical size in solution (hydrodynamic radius).
- Stationary Phase: Porous particles with a carefully controlled, specific pore size.
- Separation Principle: Molecular filtration.
- Elution Order: Large molecules cannot enter the pores and pass quickly around the particles; they elute first. Small molecules enter the pores, taking a longer, more complex path through the column; they elute last.
- Application: Determining the molecular weight distribution of polymers or separating large biomolecules.
5.5 Hydrophilic Interaction Liquid Chromatography (HILIC)
HILIC is a “hybrid” mode used for compounds that are too polar to be retained by reversed-phase.
- Stationary Phase: Polar (like Normal-Phase), such as silica.
- Mobile Phase: A polar mixture (like Reversed-Phase), typically high in organic solvent (e.g., acetonitrile) with a small amount of water.
- Separation Principle: The analytes partition into a water-rich layer adsorbed onto the polar stationary phase.
- Application: This mode is the solution for the primary weakness of RP-HPLC. Very polar analytes (like amino acids, metabolites, or carbohydrates) that wash out of a C18 column with no retention will be strongly retained and separated by HILIC.
Table 1: Quick Guide to HPLC Separation Modes
| Separation Mode | Stationary Phase | Mobile Phase | Separation Principle | Elution Order |
| Reversed-Phase (RP) | Non-Polar (e.g., C18) | Polar (e.g., Water/Acetonitrile) | Hydrophobicity | Polar compounds elute first. |
| Normal-Phase (NP) | Polar (e.g., Silica) | Non-Polar (e.g., Hexane) | Polarity | Non-polar compounds elute first. |
| Ion-Exchange (IEX) | Charged Surface | Aqueous Buffer (Salt/pH Gradient) | Net Charge | Eluted by increasing salt or changing pH. |
| Size-Exclusion (SEC) | Porous Particles (Controlled Pores) | Solvent | Molecular Size | Large compounds elute first. |
| HILIC | Polar (e.g., Silica) | Polar (e.g., Acetonitrile/Water) | Hydrophilicity/Partitioning | Non-polar compounds elute first. |
6. HPLC Detectors Guide: Choosing Your “Eyes”
The detector is the component that “sees” the analytes as they elute from the column and translates their presence into a signal. No single detector can analyze all compounds. The choice of detector is a critical purchasing decision based on the properties of the analyte.
6.1 UV-Vis Detectors (The Workhorse)
This is the most common and versatile detector used in HPLC.
- Principle: Measures the amount of Ultraviolet (UV) or Visible (Vis) light absorbed by the analyte at a specific wavelength.
- Requirement: The analyte must contain a chromophore—a part of the molecule that absorbs UV or Vis light.
- Two Main Types:
- Variable Wavelength Detector (VWD): Measures absorbance at one single wavelength at a time (e.g., 254 nm), which can be changed between runs. This is robust and suitable for routine QC of known compounds.
- Diode Array Detector (DAD) / Photodiode Array (PDA): Measures absorbance across an entire spectrum of wavelengths simultaneously (e.g., 190–800 nm). This provides a complete UV-Vis spectrum for each peak. This is a significant advantage, as it allows for:
- Identification: Matching the peak’s spectrum to a known standard.
- Peak Purity: Checking if a single peak is pure or if it contains co-eluting (hidden) impurities. For method development and quality control, a DAD/PDA is superior.
6.2 Fluorescence Detector (FLD) (The High-Sensitivity Specialist)
- Principle: Shines light at one wavelength (excitation) and measures the light emitted by the analyte at a different, longer wavelength (emission).
- Requirement: The analyte must be naturally fluorescent or chemically tagged with a fluorescent label (derivatization).
- Advantages:
- High Sensitivity: Can be 10 to 1,000 times more sensitive than a UV-Vis detector.
- High Selectivity: Only fluorescent compounds will be detected, so it can find trace analytes in a complex, non-fluorescent matrix.
6.3 Refractive Index (RID) Detector (The Traditional Universal Detector)
- Principle: A “universal” detector that measures the difference in the refractive index between the pure mobile phase and the mobile phase containing the analyte.
- Advantage: It can detect almost any compound, making it ideal for analytes with no UV chromophore, such as sugars, alcohols, or polymers.
- Critical Limitations:
- No Gradient Elution: An RID cannot be used with gradient elution. A gradient, by definition, changes the mobile phase composition, which causes a constant, overwhelming drift in the refractive index baseline.
- High Sensitivity to Environment: It is highly sensitive to any change in temperature or flow rate, requiring a stable lab environment.
6.4 Evaporative Light Scattering Detector (ELSD) (The Modern Universal Detector)
- Principle: An ELSD is also a universal detector that works in three stages:
- Nebulization: The eluent from the column is sprayed into a fine mist.
- Evaporation: The mist flows through a heated tube, evaporating the volatile mobile phase.
- Detection: A solid aerosol of non-volatile analyte particles remains. A beam of light is shined through these particles, and a sensor detects the scattered light.
- Advantage: Like an RID, it detects non-volatile compounds that lack a UV chromophore.
- Key Advantage over RID: An ELSD is fully compatible with gradient elution , as the mobile phase is evaporated and removed before detection. This makes it the superior choice for analyzing complex mixtures of unknown, non-UV-absorbing compounds.
6.5 Mass Spectrometry (MS) Detector (The Definitive Identifier)
- Principle: This is a hyphenated technique known as LC-MS. The HPLC system (LC) first separates the mixture. The eluent is then directed into the mass spectrometer (MS), which acts as the detector. An interface (like ESI or APCI) is required to remove the solvent and ionize the analytes.
- Advantage: An MS detector provides information that no other detector can: the molecular weight and structural fragmentation of the analyte. This allows for definitive identification.
- Application: It is the “gold standard” for pharmaceutical drug metabolism studies, proteomics, environmental analysis, and clinical diagnostics.
Table 2: HPLC Detector Selection Matrix
| Detector | Principle | Selectivity | Gradient Compatible? | Typical Applications |
| UV-Vis (VWD/DAD) | Light Absorption | Selective (Requires Chromophore) | Yes | Most common; pharmaceuticals, proteins, organics. |
| Fluorescence (FLD) | Light Emission | Highly Selective (Requires Fluorophore) | Yes | Trace analysis, environmental (PAHs), amino acids. |
| Refractive Index (RID) | Refractive Index | Universal | No | Sugars, polymers, alcohols (Isocratic only). |
| Evaporative Light (ELSD) | Light Scattering | Universal (for Non-Volatiles) | Yes | Sugars, lipids, peptides, polymers (Gradient). |
| Mass Spectrometry (MS) | Mass-to-Charge Ratio | Highly Selective | Yes | Definitive identification, drug metabolites, proteomics. |
7. HPLC in Action: Real-World Industry Applications
HPLC is not just an academic tool; it is a critical instrument in major industries. For B2B clients, its value often lies in quality control and regulatory compliance.
7.1 Pharmaceutical and Biopharmaceutical
HPLC is a non-negotiable “gold standard” in the pharmaceutical industry.
- Quality Control (QC): Used to verify the purity, potency (quantity), and identity of Active Pharmaceutical Ingredients (APIs) and finished drug products (tablets, capsules).
- Impurity Profiling: Detects and quantifies trace-level impurities or degradation products that may arise during synthesis or storage. This is a mandatory requirement by regulatory agencies like the FDA and follows ICH guidelines.
- Stability Studies: HPLC is used to determine a drug’s shelf life by monitoring its degradation over time under various conditions.
7.2 Biotechnology (Protein and Peptide Analysis)
The introduction of HPLC revolutionized the biological sciences. RP-HPLC, in particular, offers high-resolution separation of very similar biomolecules.
- Purity Analysis: It can separate protein variants that differ by only a few amino acids, such as human and bovine insulin.
- Characterization: A combination of modes (RP-HPLC, IEX, and SEC) is used to analyze, purify, and characterize recombinant proteins and peptides. This requires wide-pore columns (e.g., 300 Å) to allow the large molecules to interact with the stationary phase.
7.3 Food and Beverage
HPLC is used for routine analysis of food composition, safety, and quality.
- Caffeine Analysis: A common application is the quantification of caffeine in energy drinks, coffee, and soft drinks to ensure it matches the amount stated on the label.
- Vitamin Analysis: An HPLC-PDA method can be developed to simultaneously separate and quantify multiple water-soluble vitamins (like B-vitamins) and caffeine in a single 16-minute run.
- Other Applications: Detecting preservatives, antioxidants, artificial sweeteners, and mycotoxins (toxins from mold) in grains.
7.4 Environmental Testing
Environmental analysis is heavily driven by regulations from agencies like the U.S. EPA, which mandate the detection of trace-level contaminants.
- Water Quality: HPLC is used to monitor drinking water and wastewater for pollutants, including pesticides, herbicides, pharmaceuticals, and heavy metals.
- Soil Analysis: Used to identify and quantify contaminants in soil, such as Polycyclic Aromatic Hydrocarbons (PAHs) from industrial activity.
- PFAS Analysis: The combination of HPLC with tandem mass spectrometry (LC-MS/MS) is the standard, EPA-approved method for detecting “forever chemicals” (PFAS) at parts-per-trillion (ppt) levels.
7.5 Clinical Diagnostics
In clinical labs, HPLC (especially LC-MS/MS) is increasingly replacing older, less specific methods like immunoassays.
- Therapeutic Drug Monitoring (TDM): Used to measure the exact concentration of a drug (like immunosuppressants) in a patient’s blood. This allows doctors to personalize dosing to be both safe and effective.
- Biomarker Analysis: HPLC and LC-MS/MS are considered the “gold standard” for measuring endogenous compounds like Vitamin D (specifically, 25-hydroxyvitamin D).
8. From Lab to Result: A Practical HPLC Workflow
Successfully running an HPLC analysis requires careful preparation. Most “instrument problems” are actually a result of poor preparation.
8.1 Step 1: Mobile Phase Preparation
A common rule in chromatography is: “Garbage in, garbage out”.
- Use High-Purity Solvents: Only HPLC-grade or MS-grade solvents should be used. Lower-grade solvents contain impurities that can create baseline noise or permanently contaminate the column.
- Filter the Mobile Phase: All mobile phases, especially aqueous buffers, must be filtered through a 0.45 µm or 0.22 µm membrane filter. This removes microscopic particles that can clog the pump, injector, and column frit.
- Degas the Mobile Phase: As discussed in Section 3.1, dissolved air must be removed to prevent bubbles. If the system does not have an inline degasser, offline methods must be used, such as Helium Sparging (bubbling helium gas through the solvent, >80% effective) or Vacuum Filtration (filtering while under vacuum, ~60% effective).
8.2 Step 2: Sample Preparation
This is the most critical step for protecting the column and ensuring an accurate result.
- Filtration (Minimum Requirement): Never inject an unfiltered sample. All samples must be passed through a 0.22 µm syringe filter before being placed in an autosampler vial. This is the single best way to prevent column clogging and high backpressure.
- Solid Phase Extraction (SPE) (For Complex Samples): For “dirty” or complex matrices (like plasma, urine, or soil extracts), simple filtration is not enough. SPE is a sample cleanup technique that removes interfering matrix components and can also be used to concentrate (enrich) the analyte of interest. It is essentially a low-resolution form of chromatography used for preparation.
8.3 Step 3: How to Read a Chromatogram
The chromatogram is the final data output.
- Retention Time (tR):
- Definition: The time from the moment of injection to the center (apex) of the peak.
- Use (Qualitative): Under identical conditions, a specific compound will always have the same retention time. This is used for identification by comparing the tR of an unknown peak to the tR of a known reference standard.
- Peak Area (or Height):
- Definition: The area under the peak, calculated by the data system.
- Use (Quantitative): The peak area is directly proportional to the concentration of that component in the sample. By running standards of known concentrations, a calibration curve can be created to quantify the amount of the analyte in the unknown sample.
8.4 Step 4: Basics of Method Development
Method development is the process of finding the right set of conditions (column, mobile phase, etc.) to achieve a good separation.
- Choose a Column: A C18 column is the most common starting point for new methods.
- Run a Scouting Gradient: The fastest way to start is to run a broad, fast gradient (e.g., 5% to 95% organic solvent over 20 minutes). This shows where the peaks elute.
- Decide on Isocratic vs. Gradient: If all peaks elute early in the scouting run (e.g., within the first 25% of the gradient time), an isocratic method may be better. If peaks are spread across the entire run, a gradient method is necessary.
- Optimize: Fine-tune the separation by adjusting parameters like mobile phase pH (for ionizable compounds), gradient slope, and column temperature.
8.5 Step 5: Method Validation Parameters
For regulated laboratories (pharma, clinical, environmental), a method is not useful until it is validated. Validation proves that the method is reliable, accurate, and suitable for its intended purpose. Key parameters, as defined by the ICH, include :
- Specificity: Proof that the peak being measured is the analyte of interest, with no interference from other components.
- Linearity: Proof that the detector response (peak area) is proportional to concentration over a specified range.
- Accuracy: How close the measured value is to the true, known value.
- Precision: The degree of agreement among repeated measurements (e.g., %RSD < 2%).
- Limit of Detection (LOD): The lowest concentration that can be reliably detected.
- Limit of Quantitation (LOQ): The lowest concentration that can be accurately quantified.
- Robustness: Proof that the method is unaffected by small, deliberate changes in parameters (e.g., ±2°C column temperature, ±0.1 pH units), demonstrating its reliability for routine use.
9. Common HPLC Troubleshooting Guide
This section addresses the most common problems encountered in the lab. Most issues fall into three categories: pressure, peaks, or baseline.
Table 3: HPLC Troubleshooting Quick Reference
| Problem | Observation | Common Cause(s) | Solution(s) |
| Pressure | Pressure Too High | 1. Blockage: Most often a clogged guard column or analytical column inlet frit. 2. Precipitation: Buffer salts precipitating in high organic mobile phase. |
1. PREVENTION: Filter all samples and mobile phases. 2. Isolate: Remove the column and check system pressure. If normal, the column is clogged. 3. Fix: Replace the guard column. Try back-flushing the analytical column. |
| Pressure Fluctuating | 1. Air Bubbles in the pump. 2. Failing pump check valve. |
1. Purge the pump to remove bubbles. 2. Degas mobile phases thoroughly. 3. Replace check valves if purging fails. |
|
| Pressure Too Low | 1. A leak in the system. | 1. Systematically check all fittings from the pump to the detector for drips or salt residue. Tighten or replace as needed. | |
| Peak Shape | Peak Tailing | 1. Strong Sample Solvent: Sample dissolved in a solvent much stronger than the mobile phase. 2. Wrong pH: Analyte is ionizable and mobile phase pH is not buffered correctly. 3. Column Overload: Injected too much sample. 4. Column Contamination/Age: Column is dirty or at end of life. |
1. Dissolve sample in the starting mobile phase. 2. Add a buffer to the mobile phase. 3. Reduce injection volume or sample concentration. 4. Wash column; if no fix, replace column. |
| Split or Broad Peaks | 1. Clogged Frit: Partial blockage at the column inlet.
2. Column Void: Column packing has settled or collapsed, creating a void at the inlet. 3. Injector Issue: Sample loop partially blocked. |
1. Replace guard column. 2. Try reversing and flushing the analytical column. 3. If a void is present, the column must be replaced. |
|
| Baseline | No Peaks | 1. Injector Issue: Needle clogged or valve failed. 2. Detector Off: Lamp is burned out or turned off. |
1. Check injector for operation. 2. Check detector status and lamp energy. Replace lamp. |
| Noisy Baseline | 1. Air Bubbles in the pump or detector cell. 2. Mobile phases not mixing properly. |
1. Degas mobile phases and purge the entire system. | |
| Drifting Baseline | 1. Column Not Equilibrated: The column has not reached a stable state with the mobile phase (most common cause). 2. Temperature Change: Column temperature is fluctuating. |
1. Increase the column equilibration time before injecting.
2. Use a column thermostat (oven). |
10. HPLC vs. UHPLC: A Guide for Labs and Procurement
A primary decision for any modern laboratory is whether to invest in HPLC or UHPLC (Ultra-Performance Liquid Chromatography). UHPLC is an evolution of HPLC designed for higher speed and efficiency.
The differences are not just semantic; they are based on fundamental engineering changes.
- Particle Size:
- HPLC: Uses 3 µm to 5 µm particles.
- UHPLC: Uses sub-2 µm particles (e.g., 1.7 µm).
- System Pressure:
- HPLC: Pumps are designed to operate up to 400–600 bar (6,000–9,000 psi).
- UHPLC: The sub-2 µm particles create extreme backpressure. UHPLC systems are engineered to handle this, operating at pressures up to 1,000–1,500 bar (15,000–22,000 psi).
- Speed and Resolution:
- Speed: UHPLC is significantly faster. An analysis that takes 10 minutes on an HPLC might be completed in 1-2 minutes on a UHPLC. One example showed a run time reduction from 2.5 min to 1.5 min.
- Resolution: The small particles generate much higher efficiency, leading to narrower, taller peaks. This means superior resolution (better separation of close peaks) and higher sensitivity (easier to detect trace compounds).
- Solvent Consumption:
- UHPLC typically uses shorter columns with smaller internal diameters and lower flow rates, resulting in a significant reduction in solvent consumption per analysis.
How to Choose: HPLC or UHPLC?
This is a strategic decision for a lab, not just a technical one.
Reasons to choose HPLC:
- Robustness: HPLC is the proven, established workhorse. It is ideal for routine QC environments.
- Legacy Methods: If a laboratory is running established, validated methods (e.g., from the USP or a regulatory filing), these methods were almost certainly developed on HPLC. They cannot be simply moved to a UHPLC system without complete re-validation.
- Cost: HPLC systems have a lower initial purchase price and are often less expensive to maintain.
Reasons to choose UHPLC:
- High Throughput: When speed is the primary driver. For a lab analyzing hundreds of samples per day (e.g., bioanalysis, R&D screening), UHPLC provides a massive increase in productivity.
- Complex Samples: When analyzing highly complex mixtures (e.g., metabolites, protein digests, environmental samples) where maximum resolution is required to separate all components.
- Sensitivity: When analyzing trace levels of compounds, such as drug metabolites in biological fluids.
UHPLC is not a simple “replacement” for HPLC. HPLC remains the go-to for robust, routine, and validated methods, while UHPLC is the platform for high-throughput and high-resolution R&D.
Table 4: HPLC vs. UHPLC Comparison for Procurement
| Parameter | HPLC (High-Performance) | UHPLC (Ultra-Performance) |
| Typical Particle Size | 3 µm – 5 µm | < 2 µm (e.g., 1.7 µm) |
| Max. Operating Pressure | 400 – 600 bar (6,000 – 9,000 psi) | 1,000 – 1,500 bar (15,000 – 22,000 psi) |
| Analysis Speed | Standard | Fast (3-10x faster) |
| Resolution | Good | Superior (narrower, taller peaks) |
| Sensitivity | Good | Higher |
| Solvent Consumption | Standard | Lower |
| Typical Application | Routine QC, Validated Legacy Methods | R&D, High-Throughput Screening, Complex Samples |
| Relative Cost | Lower | Higher (requires specialized equipment) |
11. Selecting the Right HPLC System for Your Laboratory
Choosing an HPLC is a long-term investment. The system is modular, and the “right” configuration depends entirely on the laboratory’s primary function. Before consulting a vendor, a lab manager, researcher, or procurement specialist should consider these questions:
- What are you analyzing?
- Examples: Small-molecule drugs, large proteins, or sugars with no UV absorption.
- This determines your: Detector (Section 6) and column pore size (Section 4). A lab analyzing sugars must have an RID or ELSD detector. A lab analyzing proteins must use wide-pore columns.
- How complex are your samples?
- Examples: A simple QC sample with 3 known components, or a complex natural product extract with 100+ unknown peaks.
- This determines your: Elution needs. A simple sample can use a basic isocratic pump. A complex sample requires a gradient pump (Section 3).
- What is your primary goal: Method Development or Routine QC?
- This determines your: Pump hardware (Section 3). An R&D lab developing new methods needs the flexibility of a Quaternary (LPG) pump. A QC lab running the same two-solvent method every day will benefit from a robust Binary (HPG) pump.
- What are your throughput and speed requirements?
- Examples: 10 samples per day or 200 samples per day.
- This determines your: Platform (Section 10). Low throughput is served by HPLC. High throughput demands the speed of UHPLC. Anything other than very low throughput requires an autosampler (Section 3).
- What is your regulatory environment?
- Examples: Basic academic research or a cGMP/FDA-regulated pharmaceutical lab.
- This determines your: Data integrity needs. A regulated lab requires an autosampler for injection precision and chromatography data software that is compliant with regulations (e.g., 21 CFR Part 11).
If you are ready to find the right HPLC for your laboratory, please browse our complete product range: HPLC
This guide is maintained by HINOTEK’s core technical team, comprised of senior engineers and application scientists with over two decades of hands-on experience in fields such as microscopy, centrifugation, and spectrophotometry. We are committed to ensuring that every piece of information in this guide—from instrument principles and technical specifications to laboratory procurement advice—maintains the highest level of accuracy and timeliness.
This content is regularly reviewed and updated to reflect the latest industry standards and technological advancements. We value feedback from the global scientific community. Should you have any questions or suggestions, or wish to discuss any technical details, please do not hesitate to contact our expert team at [email protected].
Workcite:
- What is HPLC (High Performance Liquid Chromatography
- How an HPLC Pump Works | Thermo Fisher Scientific – US
- Which is Better, Manual Injection or an Autosampler? | Separation …, https://www.sepscience.com/hplc-solutions-118-which-is-better-manual-injection-or-an-autosampler-6951
- Buyer’s Guide: HPLC Autosamplers | Labcompare.com, https://www.labcompare.com/10-Featured-Articles/593843-Buyer-s-Guide-HPLC-Autosamplers/
- Types of HPLC Detectors | Phenomenex, https://www.phenomenex.com/knowledge-center/hplc-knowledge-center/hplc-detectors
- Detectors Used In HPLC | DAD, UV Detector & More., https://www.scioninstruments.com/us/blog/the-different-types-of-hplc-detectors/
- HPLC System Components | Thermo Fisher Scientific – US, https://www.thermofisher.com/us/en/home/industrial/chromatography/chromatography-learning-center/liquid-chromatography-information/hplc-system-components.html
- Exploring the Key Components of an HPLC System: A … – GMI Inc., https://www.gmi-inc.com/exploring-the-key-components-of-an-hplc-system-a-comprehensive-guide/
- HPLC Column Technical Guide | GL Sciences, https://www.glsciencesinc.com/blog/hplc-column-technical-guide