Ultimate UV-Vis Spectrophotometer Buying Guide: From Application Needs to Investment Decisions
Guide Navigation
Chapter 1: Introduction — Starting with “What Do I Need?” Not “Which is the Best?”
1.1. Beyond Basic Parameters: Why an “Ultimate Guide” is Crucial
In the modern analytical laboratory, the Ultraviolet-Visible (UV-Vis) spectrophotometer is one of the most widely used and fundamental instruments. However, the breadth of the market and the depth of the technology also present significant challenges for purchasers. With a vast array of models, from educational-grade devices costing a few hundred dollars to research-grade systems priced in the hundreds of thousands, the parameters are complex and often bewildering. A simple product catalog or a parameter comparison sheet is far from sufficient to support a wise, forward-looking capital investment decision. The purpose of this guide is precisely to move beyond such superficial comparisons and provide a systematic decision-making framework.
The core principle of a successful purchase is not to seek the “best” or “most expensive” instrument on the market, but to accurately identify and acquire the one that is “most suitable” for the laboratory’s current and future needs. An instrument with superior performance but redundant functions is a waste of budget; conversely, a low-cost device that cannot meet critical application requirements may lead to experimental failure and invalid data, resulting in greater hidden losses. Therefore, the value of this ultimate guide lies in its ability to lead users through an inside-out review: first, clearly define their core applications, performance requirements, sample characteristics, and workflow, and then precisely match these specific needs with the complex technical parameters, optical designs, software functions available in the HINOTEK’s spectrophotometer list. This guider will serve as an experienced technical consultant, helping our customers (Laboratory equipment distributors, lab managers, researchers, and procurement specialists) navigate the sea of information to ultimately make a confident, rational, and value-maximized purchasing decision.
1.2. The Core Selection Philosophy: Driving Procurement Decisions with Application Needs
To avoid falling into the “parameter race” trap, we propose an application-centric, three-step selection methodology. This methodology will run through this entire guide, helping you build a clear decision path:
- Application Definition: This is the cornerstone of the entire selection process. You must first clearly answer the following questions: What is the primary purpose of the instrument? Is it for nucleic acid and protein quantification in life sciences?1 Is it for characterizing the optical properties of thin films, coatings, or nanoparticles in materials science?3 Is it for active pharmaceutical ingredient (API) content determination or dissolution testing in the pharmaceutical industry, strictly following pharmacopeia standards?5 Or is it for routine detection of water pollutants in environmental monitoring? Different applications have vastly different requirements for the instrument, which will directly determine the subsequent performance considerations.
- Performance Matching: After clarifying the application, the next step is to translate the application needs into specific instrument performance indicators. For example, if your main task is to analyze high-concentration stock solutions, the instrument’s “stray light” level and “photometric range” become primary considerations. If you need to resolve structurally similar components in a complex mixture, then “spectral bandwidth” (resolution) is crucial. If the experiment involves monitoring enzyme kinetics for several hours, the instrument’s “baseline stability” (drift) and “temperature control accuracy” will be key to success. At this stage, you need to prioritize the various technical parameters.
- Budget & Future-Proofing: Finally, make the final trade-offs within a clear budget framework. This involves not only considering the purchase price of the main unit but also evaluating its “total cost of ownership,”. At the same time, forward-thinking is essential: Is it possible for the lab to venture into new research directions in the future? Does the instrument have sufficient expandability, for example, does it support accessories such as integrating spheres, autosamplers, multi-cell holders, and temperature controllers? Choosing an instrument that can grow with the lab is key to maximizing the return on investment.
1.3. A Review of the Beer-Lambert Law: The Theoretical Foundation of All Measurements
The ability of UV-Vis spectrophotometry to perform accurate quantitative analysis is theoretically rooted in the Beer-Lambert Law. The mathematical expression of the law is:
A=ϵbc
Where:
- A is Absorbance (dimensionless)
- ε (epsilon) is the molar absorptivity, an intrinsic physical constant of a substance at a specific wavelength and in a specific solvent, with units of (L⋅mol⁻¹⋅cm⁻¹)
- b is the path length, the distance the light travels through the sample, typically determined by the width of the cuvette, with a standard of 1 cm.
- c is the molar concentration of the absorbing substance, with units of mol⋅L−1.
Absorbance A itself is calculated by measuring the incident light intensity (I0) and the transmitted light intensity (I), with the relationship being A=log10(I0/I). The physical significance of the Beer-Lambert Law is that it reveals a perfect linear positive correlation between a substance’s absorbance and the product of its concentration and path length under ideal conditions. This allows us to determine the concentration of an unknown sample by preparing a series of standard solutions of known concentrations, measuring their absorbance, and plotting a standard curve.
However, understanding this law must not stop at the formula itself. More importantly, one must deeply understand the conditions for its validity and the reasons for “deviations” in actual measurements, as this directly relates to instrument selection and the accuracy of experimental results.
Limitations of the Law and Analysis of “Deviation” Phenomena
The linear relationship of the Beer-Lambert Law is not unconditionally valid; it relies on a series of strict assumptions :
- Ideal Monochromatic Incident Light: The incident light must be of a single wavelength, parallel, and irradiate the sample perpendicularly.
- Homogeneous, Non-Scattering System: The solution must be clear and uniform, without suspended particles or emulsions that cause light scattering.
- No Interaction Between Absorbing Particles: Solute molecules should remain independent. At high concentrations, phenomena like association, dissociation, or interaction with the solvent can change their absorption characteristics, leading to deviation.
- No Other Optical Processes: The interaction between radiation and matter is limited to absorption, with no other processes that consume or produce photons, such as fluorescence, phosphorescence, or photochemical reactions.
In actual measurements, the standard curve often deviates from linearity in the high-concentration region, showing a “negative deviation” (bending towards the concentration axis) or a “positive deviation” (bending towards the absorbance axis). Chemical factors (like intermolecular interactions) are one cause, but a more common and instrument-performance-related physical factor is non-ideal monochromatic light—specifically, the presence of “Stray Light.”
The logic behind this phenomenon is key to understanding the value of high-end instruments. The Beer-Lambert Law assumes that all light reaching the detector is the specific measurement wavelength light that has passed through the sample. However, any spectrophotometer’s optical system inevitably contains “stray light”—this could be light of non-measurement wavelengths or light scattered internally by optical components (like mirrors or gratings) that reaches the detector without passing through the sample.
When analyzing low-concentration samples, their absorbance is low, and most of the measurement light is transmitted. The proportion of stray light is negligible and its effect can be ignored. But when analyzing high-concentration samples, the sample’s absorbance is very high (e.g., A>2.0), and the vast majority of the measurement wavelength light (I) is absorbed. At this point, the nearly constant intensity of the stray light (Istray) becomes a significant portion of the total light intensity received by the detector (Imeasured=I+Istray). Because the instrument mistakenly treats this stray light as transmitted light, the calculated transmittance (Tmeasured=Imeasured/I0) is higher than the true transmittance (Ttrue=I/I0), leading to a calculated absorbance (Ameasured=−logTmeasured) that is lower than the true value. As the concentration further increases, this deviation becomes larger, eventually causing the standard curve to bend downwards, exhibiting a “negative deviation”.
Therefore, a seemingly simple problem of a “non-linear standard curve” directly reveals the bottleneck of an instrument’s performance. If a lab’s daily work involves the precise measurement of high-concentration samples (such as drug stock solutions, high-concentration dyes, or optical filters), then the instrument’s “stray light” specification transforms from a seemingly minor technical parameter into a core factor determining the success of the purchase. This also directly leads to the need for advanced optical designs like double monochromators, which can achieve extremely low stray light, a topic we will explore in detail in the next chapter.
Chapter 2: Deconstructing Core Technologies: A Deep Dive into the “Heart” of the Spectrophotometer
The performance of a UV-Vis spectrophotometer is fundamentally determined by the precision and design philosophy of its core components, including the optical system, light source, monochromator, and detector. Understanding the inner workings of this “black box” is key to discerning the real differences between instruments of various grades and is a prerequisite for effectively matching application needs with technical specifications.
2.1. Optical System Configuration: The Choice Between Single-Beam and Double-Beam
Single-Beam Spectrophotometer
The basic configuration of the optical system is divided into single-beam and double-beam, which is the first important watershed for distinguishing instrument grades and application scenarios.
- Single-Beam Spectrophotometer
Its optical design is very direct: light from the source passes through the monochromator, and the resulting beam sequentially passes through the reference cell (typically a cuvette with blank solvent) and the sample cell before reaching the detector. The measurement process involves two steps: first, inserting the reference cell for a blank correction (measuring I0), and then replacing it with the sample cell for the sample measurement (measuring I).
Advantages: Simple structure with fewer optical components, making it cost-effective and typically more compact. Its simple light path makes it more sensitive to small changes in the sample, making it ideal for routine quality control (QC), teaching experiments, and budget-conscious laboratories.
Disadvantages: The biggest drawback is its stability. Since the reference and sample measurements are separated in time, any fluctuations in the light source energy or drift in the detector response during this period cannot be compensated for and will directly introduce measurement errors. Therefore, single-beam instruments are not suitable for applications requiring long-term continuous monitoring, such as enzyme kinetics or drug dissolution testing.
Double-Beam Spectrophotometer
The double-beam design aims to overcome the stability issues of the single-beam system. After the monochromator, a beam of monochromatic light is split into two equal-energy paths by a chopper or a beam splitter: one passes through the sample cell (sample beam), and the other simultaneously passes through the reference cell (reference beam). The two beams are ultimately detected alternately by the same detector.
Advantages: The core advantage is its excellent long-term stability. Because the instrument can monitor the intensity of the reference beam in real-time, any energy drift caused by light source aging, voltage fluctuations, or changes in ambient temperature can be deducted in real-time, resulting in an extremely flat and stable baseline. This makes double-beam instruments the preferred choice for high-precision quantitative analysis, long-term kinetic studies, trace analysis, and research and development work. For example, HINOTEK L7 spectrophotometer is a typical representative of a double-beam design, ensuring reliability for long-term measurements.
Disadvantages: The optical structure is more complex with more components, leading to higher costs and a relatively larger size.
Choosing between a single-beam and a double-beam is not a simple judgment of “good” versus “bad,” but a strategic decision based on application needs. For a pharmaceutical laboratory, method development and quality control require extremely high repeatability and data reliability to comply with regulatory requirements. In this scenario, the stability provided by a double-beam design is fundamental to ensuring the validity of experimental data, making it a “must-have” investment. The compensation for light source drift can prevent significant systematic errors caused by baseline shifts during dissolution tests that can last for several hours. Conversely, for a teaching lab or a QC lab that only performs simple colorimetric assays, a single-beam instrument, with its high cost-effectiveness and ease of use, can fully meet the requirements.
2.2. Light Source Module: The First Step in Lighting Up the Analysis
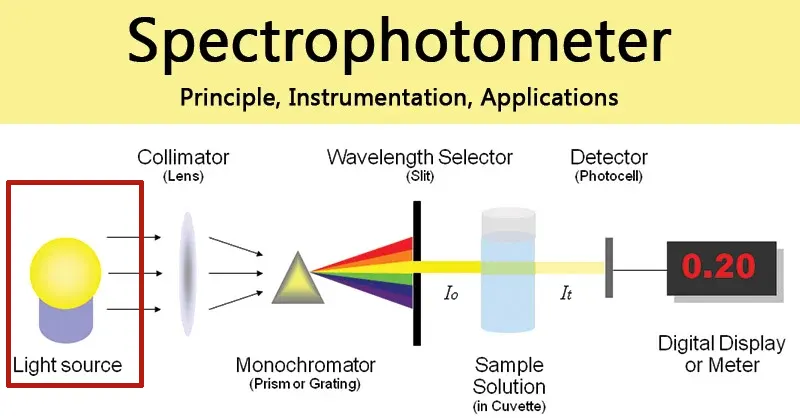 |
The light source is the starting point of the entire analytical process, and its performance directly affects the instrument’s wavelength range, energy output, and stability.
- Deuterium Lamp & Tungsten Lamp: This is the most classic and mature light source combination.
- Deuterium Lamp: An ideal ultraviolet light source, its continuous spectrum typically covers the range of 185 nm to 400 nm. When the deuterium lamp is working, its maximum energy is around 230 nm, making it very suitable for detecting substances with strong absorption in the UV region, such as nucleic acids. In addition, the deuterium lamp has two characteristic spectral lines in the visible region at 486.0 nm and 656.1 nm, which are often used by instruments for automatic wavelength accuracy calibration.
- Tungsten: Provides a continuous spectrum in the visible and near-infrared regions, with an applicable wavelength range generally from 320 nm to 1100 nm or even wider.These two light sources are usually integrated into one module, and the instrument will automatically switch between them via a mirror for seamless transition between the UV and visible regions based on the set wavelength.
- Xenon Lamp:
- The xenon lamp has become an increasingly popular light source in recent years, especially in mid-to-high-end and micro-volume spectrophotometers.
- Advantages: As a high-intensity flash lamp, the core advantages of a xenon lamp are:
- Long Lifespan & No Warm-up: The xenon lamp only emits high-intensity pulses of light at the moment of measurement, rather than being continuously lit. This results in an extremely long lifespan and allows for immediate use upon startup, without the need for a warm-up period like a deuterium lamp.
- High Energy Across the Full Spectrum: A single xenon lamp can provide sufficient energy from the ultraviolet to the near-infrared region, eliminating the need to switch light sources.
- Protection of Photosensitive Samples: The flashing operation means the total time the sample is exposed to light is extremely short. This is crucial for analyzing sensitive samples that are prone to photolysis or light-induced conformational changes (such as certain proteins or photosensitive drugs).
HINOTEK uses xenon lamps in our micro-volume spectrophotometers and fluorescence spectrophotometers.
The choice of light source is closely related to the overall optical design philosophy of the instrument. Traditional high-performance scanning spectrophotometers, in pursuit of ultimate resolution and low stray light, typically use a continuously operating deuterium/tungsten lamp combination, paired with a precision mechanical scanning monochromator.
Xenon lamps, on the other hand, are more often combined with modern array detector technology (Diode Array Detector, DAD, or CCD). In this design (sometimes called a polychromator system), the full-spectrum “white light” from the source first passes through the sample. After selective absorption by the sample, the transmitted full-spectrum light enters a fixed polychromator (usually a grating), where it is dispersed into a rainbow spectrum and projected onto a linear detector array. Each pixel on the detector corresponds to a specific wavelength, allowing the entire spectrum to be captured simultaneously in an instant (usually less than 1 second).
This design offers unparalleled measurement speed. Therefore, for applications requiring high-throughput screening, rapid kinetic studies, or instant access to full-spectrum information for component identification, an array-based instrument equipped with a xenon lamp is the ideal choice. Thus, when a salesperson emphasizes the “long life of a xenon lamp,” a savvy buyer should realize that this is not just about a more durable light bulb. It likely signifies a completely different optical working mode that brings significant advantages in speed and sample protection, but may also involve trade-offs in traditional metrics like resolution and stray light compared to top-tier scanning instruments.
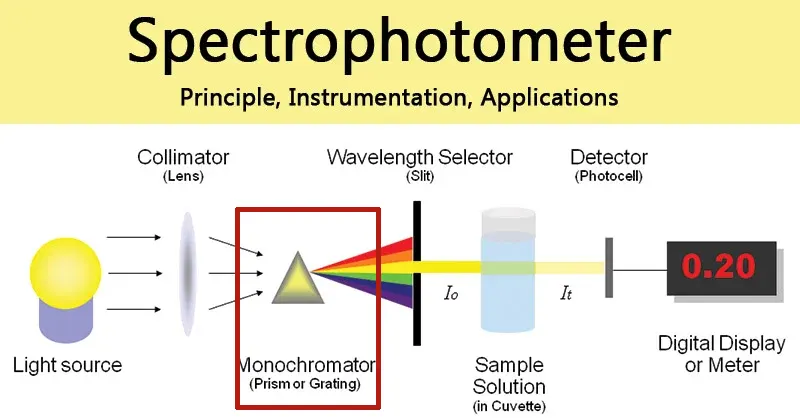
2.3. The Monochromator: The Decisive Component for Instrument Performance
The monochromator is the “heart” of the spectrophotometer. Its core function is to decompose the composite light (white light) from the source into a series of monochromatic light beams arranged by wavelength, and to precisely select the specific wavelength required for the experiment. A typical monochromator consists of an entrance slit, a collimating mirror, a dispersion element, a focusing mirror, and an exit slit, all enclosed in a light-tight box.
 |
Dispersion Element:
Early instruments used prisms, but modern instruments almost universally use a diffraction grating as the core dispersion element. Compared to prisms, gratings offer more uniform dispersion across the entire spectral range, higher resolution, and better wavelength linearity. High-end instruments often use
holographic gratings, which have extremely uniform rulings that significantly reduce stray light and improve the signal-to-noise ratio.
Single vs. Double Monochromator
This is another key differentiator between mid-range and high-end research-grade instruments.
- Single Monochromator: The instrument contains only one complete dispersion system as described above. It can meet the needs of most routine analyses.
- Double Monochromator: As the name suggests, the instrument has two monochromator systems connected in series. Light from the source first passes through the first monochromator (sometimes called a pre-monochromator) for initial dispersion and filtering. The resulting monochromatic light then enters the second monochromator (the main monochromator) for a second, more refined dispersion. The HINOTEK Q-8 is a typical example of a double monochromator design, with its spectrometer consisting of a pre-monochromator and a main monochromator, each containing two gratings. By switching between the four gratings, it covers an ultra-wide wavelength range.
The greatest advantage of a double monochromator is its unparalleled stray light rejection capability. The light is filtered twice, and the vast majority of non-target wavelength stray light is completely eliminated. This allows double monochromator instruments to reduce stray light levels by several orders of magnitude (e.g., from a common 0.01% for single monochromators to 0.0001% or lower), For example, the stray light of our Q-8 double-beam spectrophotometer is less than 0.00005%T.
What is the practical significance of this performance improvement? As mentioned in the first chapter, stray light is the fundamental factor limiting the linear measurement range of an instrument. For routine analysis of dilute solutions (absorbance < 2.0 A), a high-quality single monochromator instrument is sufficient. However, in many advanced materials science and pharmaceutical research applications, the samples themselves may have high absorbance. For example:
- Measuring the minute transmittance of highly reflective or opaque optical coatings.
- Analyzing the purity of high-concentration drug stock solutions without dilution, to avoid introducing additional errors.
- Studying the diffuse reflectance spectra of turbid samples or solid powders.
In these scenarios, the sample’s absorbance may far exceed 3.0 A, even reaching 5.0 A or 6.0 A. At this point, a single monochromator instrument, due to its inherent stray light level, will produce severely distorted results, or even fail to provide meaningful data at all. A double monochromator instrument, with its extremely low stray light, can extend the accurate photometric range (linear range) to 6.0 A or even 8.0 A, making it the only way to complete such challenging applications. Therefore, when selecting an instrument, users must calmly assess the types of samples they may encounter in the future. If the research involves any high-absorbance or highly scattering materials, investing in a double monochromator instrument is crucial to avoid future experimental bottlenecks and ensure the smooth progress of research.
If you have such needs, you may consider our Q-8 double-beam spectrophotometer.
2.4. In-depth Analysis of Key Performance Indicators
In addition to the macroscopic optical configuration, a series of specific performance indicators collectively define the quality of a spectrophotometer. Understanding the meaning of these indicators and their impact on analytical results is the basis for making a smart comparison.
-
- Spectral Bandwidth (SBW)
Spectral bandwidth refers to the spectral purity of the monochromatic light beam exiting the monochromator, i.e., the width of the wavelength range, usually expressed in nanometers (nm). It is essentially determined by the slit width inside the monochromator. Spectral bandwidth is the core indicator of the instrument’s resolution.
Narrow Bandwidth: (e.g., ≤ 1 nm) means the instrument can resolve two very close absorption peaks on the spectrum, providing more detailed spectral structure information. This is crucial for identifying structurally similar compounds, analyzing complex mixtures, and following analytical methods with strict resolution requirements in pharmacopeias (such as the European Pharmacopoeia).
Wide Bandwidth (e.g., 2-5 nm), although having lower resolution, allows more light energy to pass through, resulting in a higher signal-to-noise ratio and better photometric stability. For routine colorimetric quantitative analysis that does not require high resolution, it is perfectly adequate and suitable.High-end instruments often offer a variable bandwidth function, allowing users to choose according to different experimental needs. For example, HINOTEK UV-1700S UV Visible Spectrophotometer is single-beam, it still offers adjustable bandwidth options: 0.5/1.0/2.0/4.0nm.
- Spectral Bandwidth (SBW)
- Stray Light
As mentioned earlier, stray light refers to any radiation detected by the detector that is outside the set measurement wavelength. It is a comprehensive reflection of the instrument’s optical system design, component quality (especially the grating), and internal sealing process level, and is one of the core indicators of an instrument’s quality.
Impact: High stray light severely limits the instrument’s photometric measurement range and linear range, causing measurement results to be lower at high absorbance and making the standard curve deviate from the Beer-Lambert Law.
Testing: Pharmacopeias and industry standards have clear test methods for this, such as using a specific concentration of potassium chloride (KCl) or sodium iodide (NaI) solution and measuring near their UV cutoff wavelength (e.g., 198 nm). At this point, the transmittance should theoretically be zero, and any measured transmission signal is considered stray light.
Indicator Levels: The stray light level of conventional instruments is between 0.02% and 0.1% T, while high-performance research-grade instruments (especially double monochromator models) can achieve < 0.0005% T or even lower.
- Wavelength Accuracy & Repeatability
Wavelength Accuracy refers to the agreement between the instrument’s set wavelength and the actual peak wavelength of the output monochromatic light. It ensures that the measurement is performed at the correct wavelength, which is crucial for both qualitative analysis (confirming absorption peak positions) and quantitative analysis (ensuring measurement at the maximum absorption wavelength, λmax).
Wavelength Repeatability refers to the consistency of the instrument’s actual output wavelength when scanning or setting to the same wavelength multiple times. It reflects the precision and stability of the instrument’s wavelength drive mechanism.
Calibration & Verification: These parameters are usually calibrated and verified using standard materials with known characteristic absorption peaks, such as holmium oxide (Ho2O3) solution or the characteristic emission lines of a deuterium lamp. Pharmacopeias have clear tolerance ranges for wavelength accuracy in different bands, for example, the UV region (200-400 nm) usually requires better than ±1 nm.
- Photometric Accuracy & Repeatability
Photometric Accuracy refers to the agreement between the absorbance value measured by the instrument and the true absorbance value of a standard reference material. It is fundamental to ensuring the accuracy and reliability of quantitative analysis results.
Photometric Repeatability (or photometric precision) refers to the consistency of absorbance readings when measuring the same sample multiple times. It reflects the instrument’s overall noise level and short-term stability.
Verification: Usually verified using certified standard filters (such as the NIST SRM 930 series) or a potassium dichromate (K2Cr2O7) standard solution with a stable spectrum in an acidic solution.5 Pharmacopeias also specify tolerances at different absorbance levels, for example, at an absorbance of ≤ 1 A, the accuracy requirement is ±0.010 A.
- Baseline Stability / Drift
Baseline stability, often quantified by drift, refers to the maximum change in the instrument’s absorbance reading over a period of time (e.g., per hour) under constant conditions (usually at a fixed wavelength). It reflects the instrument’s ability to resist long-term signal fluctuations caused by factors such as ambient temperature changes, and light source and detector aging. For kinetic experiments that require long-term monitoring, a double-beam system with a low drift rate (e.g., < 0.0002 Abs/h 20) is essential.
To help you connect these abstract parameters with actual selection decisions, the following table provides a clear guide.
Table 2.1: Core Technical Parameter Selection Guide for UV-Vis Spectrophotometers
| Parameter Name | Definition & Importance | Typical Value (Routine Grade) | Typical Value (Research Grade) | Selection Considerations & Application Advice |
| Optical System | The foundation determining instrument stability. Single-beam is simple and economical; double-beam provides real-time drift compensation for high stability. | Single-beam | True Double-beam | QC/Teaching/Routine Analysis: Single-beam is cost-effective. Long-term kinetics/Drug dissolution/High-precision R&D: A double-beam is mandatory to ensure data reliability. |
| Spectral Bandwidth (SBW) | Determines the instrument’s resolution. The narrower the bandwidth, the better the ability to resolve fine spectral structures. | Fixed bandwidth (2 nm, 5 nm) | Variable bandwidth (e.g., 0.1-5 nm) | Routine colorimetric quantification: 2-5 nm is sufficient. Pharmacopeia analysis/Complex mixtures/Qualitative studies: Requires a narrow or variable bandwidth that meets method requirements. |
| Stray Light | A core indicator limiting the instrument’s linear range and high-concentration measurement capability. Lower stray light allows for a higher upper limit of measurable absorbance. | ≤ 0.05% T | ≤ 0.001% T (Single Monochromator)
≤ 0.0001% T (Double Monochromator) |
Routine dilute solutions (A<2): ≤ 0.05% T is adequate. High-concentration stock solutions/Solid materials/Turbid sample analysis: An ultra-low stray light instrument is essential; a double monochromator is the best choice. |
| Wavelength Accuracy | Ensures measurements are made at the correct wavelength. Crucial for both qualitative and quantitative analysis. | ± 2.0 nm | ≤ ± 0.1 nm | All applications require high accuracy. Research-grade applications and regulatory compliance (e.g., pharma) have stricter requirements and may need features like a built-in mercury lamp for calibration. |
| Photometric Accuracy | Guarantees the truthfulness of quantitative results. Fundamental for assessing the reliability of measured values. | ± 0.005 A @ 1 A | ≤ ± 0.003 A @ 1 A | A core indicator for quantitative analysis applications (especially pharma QC). Must be checked for compliance with USP/EP pharmacopeia specifications. |
| Photometric Range | The linear range within which the instrument can accurately measure absorbance. Determined by stray light, the detector, and the electronics. | 0 – 3.5 A | 0 – 6 A or higher | Materials science/Optical research/High-concentration analysis: Requires an instrument with a wide photometric range, which is typically associated with double monochromators and high-performance detectors. |
| Baseline Stability (Drift) | Measures the instrument’s ability to resist long-term signal fluctuations. | < 0.002 Abs/h | < 0.0002 Abs/h | Long-term kinetics/Online monitoring: Low drift is a must. Double-beam systems have a natural advantage in this regard. |
Chapter 3: Focusing on Application Fields: Which Category Does Your Lab Belong To?
Theory and technical parameters must ultimately serve practical applications. Different scientific fields have markedly different needs for UV-Vis spectrophotometers. This chapter will delve into several major application areas and analyze their specific requirements for instrument configuration, helping you “find your fit” and identify the most suitable solution for your workflow.
3.1. Life Sciences: From Nucleic Acids and Proteins to Enzyme Kinetics
UV-Vis spectroscopy is an indispensable tool in modern molecular biology laboratories, with applications trending towards “micro-volume,” “automation,” and “specialization.”
- Technical Requirement: Core Application: Quantification and Purity Analysis of Nucleic Acids and Proteins
This is the most fundamental and frequent application, based on the characteristic absorption peaks of biological macromolecules.
Nucleic Acids (DNA/RNA): Have a maximum absorption peak at 260 nm. The concentration can be calculated using the Beer-Lambert law by measuring the A260 value.
Proteins: Proteins containing tryptophan (Trp) and tyrosine (Tyr) residues have a characteristic absorption peak at 280 nm, which can be used for direct quantification.
Purity Assessment: The A260/A280 ratio is the gold standard for assessing nucleic acid purity. Pure DNA has a ratio of approximately 1.8, while pure RNA is around 2.0. A lower ratio usually indicates protein contamination. The A260/A230 ratio is used to assess for residual contamination from chemical reagents like salts or phenol. Other applications include protein quantification using colorimetric assays (e.g., BCA, Bradford, Lowry) and measuring the optical density of bacterial cultures at 600 nm (OD600) to monitor cell growth.
Technical Requirement: Micro-Volume Sample Detection
Samples in life science research are often precious and available in small quantities (e.g., DNA extracted from a few cells or purified protein). The traditional method using 1 mL standard cuvettes is not only wasteful but also requires concentration for low-concentration samples or dilution for high-concentration ones, both of which can introduce errors.
To address this pain point, Micro Spectrophotometer were developed. Instruments like the Thermo Scientific NanoDrop series and the Mettler-Toledo UV5 Nano have completely changed the game. They use a special pedestal design where a 0.5 µL to 2 µL droplet of the sample is pipetted directly onto the measurement platform. The surface tension of the liquid forms a “liquid lens” with a very short path length, allowing for measurement. This technology eliminates the need for cuvettes and dilutions, is fast, and significantly improves workflow efficiency while conserving valuable samples. Click the link to view our Micro Spectrophotometer.
Technical Requirement: Enzyme Kinetics and DNA Thermal Denaturation Analysis
Studying the dynamic processes of biological molecules is another important area in life sciences.
Enzyme Kinetics: Investigating the catalytic rate and reaction mechanism of enzymes by monitoring the change in absorbance over time as a substrate is consumed or a product is formed.
DNA/RNA Thermal Stability Analysis: Plotting a “melting curve” by programmatically increasing the temperature and monitoring the change in absorbance at 260 nm as the DNA double helix denatures (melts). This determines its melting temperature (Tm value), which reflects the stability and structural characteristics of the DNA sequence.
The common feature of these two types of experiments is the need for continuous absorbance monitoring over a long period under precisely controlled temperature. Therefore, the requirements for the instrument are extremely stringent:
Precise Temperature Control System: Some HINOTEK spectrophotometers can be equipped with a temperature controller for precise temperature regulation.
Excellent Baseline Stability: Experiments can last for tens of minutes or even hours. A double-beam optical system with a very low drift rate must be used to ensure the reliability of the measurement results.
Powerful Kinetics Software: The software needs to support a time-scan mode and be able to automatically calculate reaction rates, Michaelis constants (Km), maximum reaction velocities (Vmax), or automatically analyze Tm values.
For buyers in the life sciences field, the mindset should shift from purchasing a “general-purpose instrument” to acquiring an “integrated workflow solution.”
3.2. Materials Science and Chemistry: Thin Films, Nanomaterials, and Routine Analysis
The application range in materials science and chemistry is extremely broad, with sample forms varying from liquids and powders to solid thin films and bulk materials. Therefore, this field places the highest demands on the instrument’s “flexibility” and “expandability.” The value of the instrument lies not only in the main unit itself but also in the breadth and depth of its accessory ecosystem.
- Core Application: Optical Property Characterization
Thin Films, Coatings, and Glass: Measuring the Transmittance, Reflectance, and Absorbance spectra of transparent or semi-transparent materials is a core task. These spectra can be used to analyze key optical parameters such as color, filtering properties, UV/IR protection, coating thickness, and haze.
Nanomaterials: UV-Vis spectroscopy is an important tool for characterizing the optical properties of nanoparticles (e.g., TiO₂, ZnO, Cu₂S). By analyzing the absorption edge of their absorption spectrum, the optical band gap of the material can be calculated, which is crucial for the R&D of semiconductors, solar cells, and photocatalytic materials.
Routine Chemical Analysis: Used in fields like chemical synthesis and quality control for substance identification, purity testing, reaction progress monitoring, and concentration quantification.
- Technical Requirement: Wide Wavelength Range and Accessory Compatibility
Due to the diversity of materials, a single liquid transmission measurement mode is far from sufficient.
Wide Wavelength Range: The characteristic absorption or reflection of many materials covers a broad region from the deep UV to the near-infrared (NIR). Therefore, an instrument with a wavelength range covering, for example, 175 nm to 3300 nm is essential for comprehensive materials research.
Comprehensive Accessory Support: This is the top priority for selection in materials science applications.
Integrating Sphere: This is the ultimate weapon for measuring scattering samples. For samples with rough surfaces or non-uniform interiors, such as powders, ceramics, textiles, and polymer sheets, normal transmission measurements will yield severely underestimated results due to light scattering. An integrating sphere is a hollow sphere whose inner wall is coated with a highly reflective diffuse material (like barium sulfate, BaSO₄). It can collect all transmitted light (total transmittance) or reflected light (diffuse reflectance) from all directions, thereby obtaining the true absorption characteristics of the sample。 Our UV-1800 dual-beam spectrophotometer can be optionally equipped with an integrating sphere.
Specular Reflectance Accessory: Used for the precise measurement of the reflectance of smooth surfaces like mirrors, polished metals, and semiconductor wafers,HINOTEK also provide this accessory.
Buyers in the materials science field, while examining the core performance of the main unit (such as wide wavelength range, low stray light, and wide photometric range from a double monochromator), must pay equal or even more attention to its accessory list. Whether a brand offers a wide variety of high-performance, easy-to-install, and switchable accessories directly determines whether the instrument can handle the complex and varied materials research tasks of the future, and is the core of its investment value.
3.3. Pharmaceuticals and Environmental Monitoring: From Quality Control to Regulatory Compliance
In the highly regulated fields of pharmaceuticals and environmental monitoring, the “accuracy,” “reliability,” and “compliance” of the instrument are the overriding primary considerations.
- Core Applications:
- Pharmaceutical Industry: UV-Vis spectroscopy is a classic analytical method specified in pharmacopeias (such as the United States Pharmacopeia (USP), European Pharmacopoeia (EP), and Chinese Pharmacopoeia (ChP)). It is widely used for:
Content Assay of APIs and Formulations: Rapid and accurate determination of whether the concentration of the active ingredient in a product meets specifications.
Dissolution Testing: Simulating the drug release process in the body to monitor the amount of drug dissolved from a solid dosage form over a specified time, a key indicator for assessing drug quality.
Related Substances/Impurity Analysis: Identifying and quantifying trace impurities in products.
Identification Tests and Color Analysis: Qualitative identification of substances or quantitative grading of the color of pharmaceutical solutions.
- Environmental Monitoring: Used to analyze various pollutants in water, soil, or air. Many national standard (GB) methods are based on UV-Vis colorimetry, such as detecting chemical oxygen demand (COD), ammonia nitrogen, nitrates, nitrites, phosphates, and various heavy metal ions (like hexavalent chromium) in water.
Technical Requirement: Regulatory Compliance and Data Integrity
These applications are highly standardized, with clear regulations for experimental methods and acceptance criteria. Therefore, the requirements for the instrument are:
1. Performance Must Meet or Exceed Regulatory Requirements: Pharmacopeias have explicit limits for key instrument performance indicators such as wavelength accuracy, photometric accuracy, stray light, and resolution.5 For example, the European Pharmacopoeia requires that when testing a 0.02% v/v solution of toluene in hexane, the ratio of absorbance at 269 nm to 267 nm must be greater than 1.5 to verify the instrument’s resolution. The purchased instrument must be able to easily pass these Performance Qualification (PQ) tests.
2.Software Must Support Data Integrity: This is a mandatory requirement for the pharmaceutical industry. The instrument’s control software must comply with FDA 21 CFR Part 11 regulations. This means the software must have comprehensive user access control (different levels of users have different operating permissions), audit trails (all operations and data modifications have unalterable records), electronic signatures, and secure data backup functions to ensure the authenticity, integrity, and reliability of all electronic records.This is not just a software option; it requires the laboratory to establish a corresponding set of Standard Operating Procedures (SOPs) to cooperate with its execution.
To help you more intuitively match applications with configurations, the following table summarizes the key selection points for different fields.
| Application Field | Core Tasks | Key Performance Indicators | Recommended Configuration | Essential Accessories |
|---|---|---|---|---|
| Life Sciences (Basic) | Nucleic acid/protein quantification, OD600 | Photometric accuracy, repeatability | Single or double-beam | Micro-volume detection, biology methods |
| Life Sciences (Advanced) | Enzyme kinetics, DNA/RNA melting curves | Baseline stability, temperature control | True double-beam | Temperature controller, kinetics software |
| Materials Science | Optical property characterization | Wide wavelength range, low stray light | Double monochromator | Integrating sphere, reflectance accessories |
| Pharmaceutical QC | API assay, dissolution testing | Photometric accuracy, stability | True double-beam | Autosampler, 21 CFR Part 11 software |
| Environmental Monitoring | Routine analysis of pollutants in water/soil (COD, ammonia nitrogen, etc.) | Stability, photometric accuracy | Single or double-beam | Long path length cuvettes (100mm) for trace analysis, Pre-programmed test kit methods |
| Routine Chemical Analysis |
Concentration quantification, Purity checks, Reaction monitoring | Photometric accuracy, Stability, Scan speed | Single-beam or Double-beam | Thermostatted cell holder, Kinetics software, Support for various cuvettes |
Chapter 4: Market Landscape and Brand Analysis: A Comprehensive Showdown Between International and Chinese Players
4.1. In-depth Analysis of Top-tier International Brands
Top-tier international brands typically dominate the mid-to-high-end market with their superior performance, deep technical heritage, comprehensive software ecosystems, and global service networks. Their products are often the standard-setters and technology trend leaders in the industry.
- Agilent – Cary Series
Positioning Analysis: Agilent’s Cary series is synonymous with high-performance research-grade spectrophotometers, focusing on meeting the most demanding scientific research needs, especially in the fields of materials science, optics, chemistry, and cutting-edge life science research, where it is a recognized benchmark.
Products and Technology:
Cary 5000 / Cary 7000 UMS: These are its flagship products, known for their unparalleled performance specifications. For example, the Cary 5000 offers an extremely wide wavelength range (175-3300 nm), covering the entire region from deep UV to near-infrared. It uses a double monochromator design, resulting in extremely low stray light and a photometric range of up to a staggering 8 Abs. The spectral bandwidth in the UV-Vis region is finely and continuously adjustable from 0.01 nm, providing top-tier resolution capabilities.
Cary 60: This is an entry-level research instrument using a xenon lamp source, popular in routine analysis and teaching for its fast scanning, long-life light source, and friendliness to photosensitive samples.
Core Strengths: In addition to top-tier host performance, Agilent’s core competency lies in its extremely powerful and rich accessory ecosystem, including various solid sample measurement accessories (integrating sphere, Universal Reflectance Accessory – URA), fiber optic probes, etc., capable of building a measurement platform to meet any complex application.
- Thermo Fisher Scientific – Evolution / GENESYS / NanoDrop Series
Positioning Analysis: Thermo Fisher Scientific is one of the manufacturers with the most comprehensive market coverage. Its product strategy is to meet a wide range of needs—from basic teaching to high-end pharmaceuticals, from routine QC to cutting-edge life sciences—through multiple clearly positioned sub-brands and series. Its strengths lie in user-friendly design, powerful application solutions, and its dominant position in the life sciences field.
Products and Technology:
NanoDrop Series (NanoDrop One, NanoDrop Lite): This series is the absolute leader and pioneer in the field of micro-volume detection. With its patented sample retention technology, it can perform rapid quantification and purity analysis of nucleic acids and proteins with just 1-2 µL of sample, making it a standard configuration in molecular biology labs worldwide.
GENESYS Series: Positioned as rugged, durable, and easy-to-use instruments for routine analysis. This series is compact in design and intuitive to operate, making it very suitable for industrial QC, environmental monitoring, and higher education laboratories.
Evolution Series (Evolution Pro): This is Thermo Fisher’s performance and research instrument platform, featuring a double-beam design for superior optical performance and flexibility. Its Insight Pro software is powerful and fully supports FDA 21 CFR Part 11 regulations, making it an ideal choice for pharmaceutical and regulated laboratories.
- Shimadzu – UV Series
Positioning Analysis: Shimadzu is renowned for its balanced performance, excellent stability, and extremely powerful software. Its product line is extensive, from entry-level to top-tier research models, all offering high reliability and user experience.
Products and Technology:
UV-3600i Plus / UV-2700i, etc.: This is Shimadzu’s high-end research-grade platform. The UV-3600i Plus uses a unique three-detector system (PMT, InGaAs, PbS) and a double monochromator design to achieve an ultra-wide wavelength range from 185 nm to 3300 nm, ultra-low stray light, and high sensitivity. Its multi-level adjustable spectral bandwidth provides excellent flexibility.
UV-1900i / UV-2600i: These are Shimadzu’s main models in the mid-to-high-end market, acclaimed for their ultra-fast scanning speed (up to 29,000 nm/min), industry-leading low stray light levels (in their class), and compact design.
LabSolutions UV-Vis Software: This is one of Shimadzu’s core competencies. The software has a friendly interface and clear operational logic, while providing powerful data processing, spectral evaluation, multitasking, and report generation functions. Its built-in validation software and good support for regulations (including 21 CFR Part 11) make it very popular in the pharmaceutical and chemical QC fields.
- PerkinElmer – Lambda Series
Positioning Analysis: PerkinElmer’s Lambda series, similar to Agilent’s Cary series, is a strong competitor in the high-end research market, with a deep history and technical advantages, especially in materials science, optical coatings, semiconductors, and high-absorbance analysis.
Products and Technology:
Lambda 850/950/1050+: This is its top-tier, modular research-grade system, also featuring a double-beam, double monochromator design, capable of achieving an extremely wide photometric range (up to 6 A or even higher) and extremely low stray light.
Lambda 25/35/45: This is its mid-range product line, known for its stable performance, low noise, high stability, and reliability, widely used in routine R&D and industrial QC.
Core Strengths: PerkinElmer offers highly professional solutions for solid sample and optical measurements, with well-designed accessories like the Universal Reflectance Accessory (URA) and integrating spheres. Additionally, the company has strong capabilities in other analytical technologies like atomic spectroscopy (AAS, ICP), enabling it to provide comprehensive solutions for cross-application needs.50 Its
UV WinLab software is also powerful, supporting various complex data acquisition and processing modes.
4.2. Overview of Excellent HINOTEK UV-Visible Spectrophotometer
With the rise of China’s manufacturing industry, significant progress has been made in the field of UV-Vis spectrophotometers, offering cost-effective solutions to the market. We provide a complete product line, ranging from basic models to advanced double-beam scanning systems. Our products are known for their reliable performance and competitive pricing, earning a strong reputation in industries such as education, environmental protection, and food testing..
- Positioning and Strengths/Weaknesses Analysis:
Strengths:
- Extremely High Cost-Effectiveness: The biggest advantage of Chinese instruments is our price, which is often much lower than that of international brands with similar configurations, making our spectrophotometer highly attractive to laboratories with limited budgets (such as university teaching labs, small and medium-sized enterprise QC).
- Fast Service: Chinese manufacturers can usually provide faster and more flexible after-sales service responses, including installation, training, repair, and application support, with lower communication costs.
- Meeting Core Needs: For the vast majority of routine quantitative analyses with absorbance below 2.0 A, HINOTEk spectrophotometer can fully meet the requirements, avoiding paying for unnecessary “performance redundancy.”
- Challenges:
- Gap in Top-tier Performance Indicators: There is still a gap compared to the flagship models of top-tier international brands in some extreme performance indicators, such as ultra-low stray light (<0.001% T), ultra-wide photometric range (>6 A), and top-tier resolution (<0.1 nm).
- High-end Accessory Ecosystem: There is room for development in the richness and precision of professional and special accessories (such as high-performance integrating spheres, variable angle reflectance accessories, and automated integrated systems).
- Software Maturity and Regulatory Compliance: The user experience of the software, the depth of data processing algorithms, and comprehensive support for international regulations (especially 21 CFR Part 11) are areas where domestic manufacturers need to continue to invest and catch up.
- After-sales service challenges: Due to cost considerations, we can only provide support through local distributors or remote assistance, making it difficult to handle complex issues.
The choice between “international vs. Chinese” should never be based on simple brand preference, but rather on a calm, objective assessment of one’s own needs. It is essentially a trade-off between “performance redundancy vs. cost-effectiveness” .
The logical chain of decision-making should be:
- First, assess whether the application needs to challenge the performance limits of the instrument. If your research involves measuring high-concentration samples with absorbance > 3.0 A, or requires resolving fine spectral structures < 0.2 nm, then choosing a high-end international model that has been rigorously tested in the global market is a more prudent and reliable choice.
- Second, if your application is routine concentration determination (absorbance < 2.0 A), colorimetric analysis, or basic teaching, then a qualified HINOTEK spectrophotometer can not only fully meet your needs but also save you a significant amount of procurement budget. In this case, pursuing the extra performance indicators of an international brand is a waste of resources.
- Finally, assess the need for service. If the laboratory has extremely high requirements for instrument uptime, or if there is high operator turnover requiring frequent training support, then Then having an international brand with global service support is a significant advantage..
4.3. Software System and Data Integrity: The Importance of 21 CFR Part 11
In modern instruments, software is no longer just a simple controller but the “brain” and “soul” of the entire analytical system. For regulated industries, especially the pharmaceutical industry, software compliance is a “one-vote veto” item in purchasing decisions.
The Title 21 of the Code of Federal Regulations, Part 11 (21 CFR Part 11), issued by the U.S. Food and Drug Administration (FDA), sets strict legal requirements for the use of Electronic Records and Electronic Signatures. Its core purpose is to ensure that all electronic data generated during drug R&D and production have authenticity, integrity, and reliability equivalent to traditional paper records and handwritten signatures.
For an instrument’s software to support 21 CFR Part 11 compliance, it must have the following core functions:
- System Validation: There must be procedures to ensure the system’s accuracy, reliability, and stable performance.
- Access Control: System access must be restricted via usernames and passwords, with multi-level user permissions (e.g., operator, administrator, reviewer) established to ensure that users can only perform their authorized operations.
- Audit Trails: The software must be able to automatically and securely record all actions related to data creation, modification, and deletion. The record must include the operator, time, action, and the values before and after the action, and this record must be unalterable.
- Electronic Signatures: Electronic signatures are legally equivalent to handwritten signatures and must include at least two independent identification components (such as an ID and password) and be securely linked to the corresponding electronic record, making them inseparable.
It is important to emphasize that no instrument or software can claim to be “21 CFR Part 11 compliant” on its own. Compliance is a system-wide effort that requires the instrument software to provide features that support compliance, while the user must establish and enforce a complete set of Standard Operating Procedures (SOPs) to manage the use of the instrument, the review of data, and the training of personnel. Software such as Thermo Fisher’s Insight Pro , Mettler-Toledo’s STARe, and Shimadzu’s LabSolutions DB/CS versions are specifically designed to meet these regulatory requirements. Therefore, for buyers in the pharmaceutical and related industries, “whether the software provides a complete 21 CFR Part 11 technical solution” must be a primary consideration during selection.
Table 4.1: Mainstream Brand Product Lines and Positioning Analys
| Brand | Main Series | Market Positioning | Core Strengths/Features | Target Application Areas |
|---|---|---|---|---|
| Agilent | Cary 60, Cary 3500, Cary 5000/7000 | High-end research & challenging applications | Top-tier optical performance (wide wavelength/photometric range), ultra-low stray light, powerful solid/optical accessory ecosystem | Materials science, Optical coatings, Semiconductors, Chemistry, Cutting-edge life sciences |
| Thermo Fisher | NanoDrop, GENESYS, Evolution | Full market coverage, solution-oriented | NanoDrop micro-volume technology, Insight Pro compliant software, strong life science application solutions | Life sciences (leading), Pharma, Industrial QC, Education, Environmental |
| Shimadzu | UV-1900i, UV-2600i, UV-3600i Plus | Balanced performance, reliable and durable | Fast scanning, low stray light, excellent stability and repeatability, powerful LabSolutions software | Pharma, Chemicals, Food, Environmental, Research, QC |
| PerkinElmer | Lambda 25/35/45, Lambda 850/950/1050+ | High-end research & industrial applications | Wide photometric range, professional materials/optical measurement accessories, powerful UV WinLab software | Materials science, Optics, Polymers, Pharma, Industrial QC |
| HINOTEK | All Series | Double Beam type can cover research applications, normal type is for Cost-effective, routine & basic applications | Highly competitive price, fast service, meets national standards and routine analysis needs. | Teaching, Routine & Basic QC, Environmental monitoring, Food safety, Small to medium-sized enterprise labs |
Chapter 5: Accessories and Expansion Capabilities: Maximizing Your Return on Investment
For fields such as materials science, optical engineering, geology, and the textile industry, direct measurement of solid samples is an essential requirement.
- Integrating Sphere
The integrating sphere is the most important accessory for handling scattering and turbid samples. It is a hollow sphere with an inner surface coated with a highly diffuse reflective material (such as barium sulfate or polytetrafluoroethylene). When a light beam enters the sphere, it undergoes countless diffuse reflections on the inner wall, creating a uniform light field.
Applications: - 1. Diffuse Reflectance Measurement: By placing the sample at the reflection port of the sphere, the reflectance spectra of rough surfaces such as powders, ceramics, paper, and textiles can be directly measured. This is crucial for color analysis and material identification.
2. Total Transmittance Measurement: By placing the sample at the entrance port of the sphere, the integrating sphere can collect all the transmitted light that passes through the sample, including light scattered in all directions. This is the only accurate method for analyzing the true transmission/absorption properties of samples like frosted glass, polymer films, and turbid solutions. - Selection Considerations: The size of the integrating sphere, the material of the inner coating, and the applicable wavelength range are key parameters. High-end instruments often offer large-sized integrating spheres that cover the full UV-Vis-NIR wavelength range.
- Specular/Universal Reflectance Accessories
Specular Reflectance Accessory (SRA): Used for the precise measurement of the reflectance of highly polished, mirror-like sample surfaces (such as mirrors, semiconductor wafers, and coated glass). The light strikes the surface at a specific angle and is detected after reflecting at the same angle.
Variable Angle or Universal Reflectance Accessory (URA): Provides greater flexibility by allowing the user to change the incident angle of the light and the receiving angle of the detector. This is crucial for studying the angle-dependent optical properties of materials, which is essential for the R&D of optical thin films and special coatings.
5.2. Liquid Sample Automation and Temperature Control
For laboratories in life sciences, pharmaceuticals, and high-throughput screening, improving the efficiency of liquid sample analysis and controlling experimental conditions are core demands.
- Autosampler/Multi-cell Holder
Multi-cell Changer: The sample compartment can accommodate multiple cuvettes (e.g., 6, 8, or even 15), and the measurement is automatically switched by a program. This is very useful for monitoring kinetic reactions of multiple samples simultaneously or for endpoint assays of batch samples, significantly increasing analysis throughput.
Autosampler: When used with a multi-cell changer, it can achieve fully automated, unattended analysis of tens or even hundreds of samples, making it an ideal choice for QC laboratories performing large-batch sample testing.
- Flow Cell
A flow cell allows a liquid sample to flow continuously through the measurement light path. Its main application is as an online detector for other separation analysis techniques, such as High-Performance Liquid Chromatography (HPLC). The eluent from the HPLC separation column passes through the flow cell, and the spectrophotometer monitors the absorbance change at a specific wavelength in real-time to obtain a chromatogram. - Temperature Control System (Peltier/Water Bath)
Precise temperature control is decisive for the study of many chemical and biochemical reactions.
- Water Bath Circulation System:
A constant temperature is maintained in the sample by circulating water from an external thermostatic water bath through the cuvette jacket. This is an economical method for temperature control, but its precision and response speed are limited.
- Peltier Temperature Control System:
This is currently the most advanced and precise method of temperature control. A Peltier element is a semiconductor cooling/heating plate that can achieve rapid and precise heating and cooling by applying an electric current. It is usually paired with a temperature sensor inserted directly into the sample solution to achieve closed-loop feedback control of the sample temperature, with an accuracy of up to ±0.1 °C.10 A Peltier system can not only maintain a constant temperature but also execute precise temperature gradient programs (heating/cooling scans), making it an essential accessory for applications such as enzyme kinetics, DNA/RNA melting curve analysis, and protein thermal stability studies.
5.3. Fiber Optic Probes
Fiber optic probe technology extends the application of the spectrophotometer from the laboratory sample compartment to the production line, reaction vessel, or any scene requiring in-situ measurement. The principle is to guide the instrument’s light into the probe through an optical fiber. The probe tip makes direct contact with the sample to complete the measurement, and the signal is then transmitted back to the detector through another fiber.
- Applications:
- Process Analytical Technology (PAT): In chemical and pharmaceutical production processes, inserting a fiber optic probe directly into a reaction vessel or pipeline allows for real-time, online monitoring of reactant/product concentration changes, reaction endpoints, or product quality, enabling real-time control and optimization of the production process.
- Dissolution Testing Integration: Inserting a fiber optic probe directly into a dissolution vessel allows for real-time monitoring of the drug dissolution process without sampling, avoiding the delays and errors of traditional sampling-dilution-measurement methods.
- Remote or Special Sample Measurement: For samples that are too large to fit in the sample compartment, or for samples in special environments (such as a glove box), fiber optic probes provide a convenient measurement method.
When making the final purchasing decision, a comprehensive review of the candidate instrument’s accessory list and expansion capabilities, combined with the laboratory’s development plan for the next 3-5 years, is a highly strategic investment behavior.
Chapter 6: Practice Makes Perfect: Sample Preparation and Measurement Techniques
6.1. Best Practices for Sample Preparation
- Homogeneity and Clarity are Prerequisites
A fundamental assumption of the Beer-Lambert Law is that the sample system is a homogeneous, non-scattering system. Any suspended solid particles, air bubbles, or emulsion droplets will scatter the incident light rather than absorb it. Scattering causes the light path to deviate, leading to a decrease in the light intensity reaching the detector, which results in an abnormally high apparent absorbance and renders the measurement results completely invalid.
Best Practices:
- Ensure that solid samples are completely dissolved and the solution is clear and transparent.
- For samples with fine particles, filtration is necessary before measurement. Using a syringe filter compatible with the sample solution (e.g., 0.45 µm or 0.22 µm pore size) is a simple and effective method.
- When transferring the sample into the cuvette, do so gently to avoid creating air bubbles. If bubbles are found, they should be carefully removed with a pipette tip.
- Solvent Selection
The solvent is the carrier for the sample, and its own properties directly affect the measurement results.
UV Cutoff Wavelength: Every solvent has a wavelength in the UV region where it begins to absorb strongly, known as the UV cutoff wavelength. Measurements must be performed at wavelengths higher than this cutoff; otherwise, the solvent’s own absorption will severely interfere with the sample signal. For example, acetone has a cutoff wavelength of about 330 nm and is not suitable for most UV region measurements, whereas water, acetonitrile, and hexane are commonly used excellent UV solvents.
Consistency of the Blank: The blank or reference solution used to correct the zero point (100% T) must be the same batch of solvent or buffer used to dissolve the sample. Any slight difference (such as pH or ionic strength) can lead to inconsistent background absorption and introduce errors.
- Concentration Control
To obtain the most accurate measurement results, the absorbance value of the sample should fall within the instrument’s optimal linear range, which is generally recommended to be between 0.2 A and 1.5 A.
Absorbance too low (< 0.1 A): The signal is too weak, the instrument’s signal-to-noise ratio is poor, and the relative measurement error is larger.
Absorbance too high (> 2.0 A): This is close to the instrument’s detection limit and is susceptible to the effects of stray light, leading to linear deviation.
Best Practice: Before the formal measurement, a quick pre-scan can be performed to get a rough idea of the sample’s absorbance. If the concentration is too high, it should be accurately diluted with the blank solvent; if the concentration is too low, consider using a long path length cuvette or concentrating the sample.
6.2. Correct Selection and Use of Cuvettes
HINOTEK also offers a variety of cuvette models and specifications. Please click on the cell category here.
The cuvette is the container where the sample interacts with the light beam. Its material, path length, and method of use have a direct, and sometimes decisive, impact on measurement accuracy.
- Material Selection
Cuvettes of different materials have different transmission ranges and must be selected according to the measurement wavelength.
- Quartz Cuvettes: Made from high-purity fused quartz, they have excellent light transmission (>80%) over a wide range from deep UV to near-infrared (typically 200 nm – 2500 nm). They are the only choice for UV region measurements.
- Glass Cuvettes: Made of optical glass, they are only suitable for the visible light region (typically 320 nm – 2500 nm). In the UV region, glass itself absorbs strongly and cannot be used.
- Disposable Plastic Cuvettes: The material is often polystyrene (PS) or polymethyl methacrylate (PMMA). They are inexpensive and avoid cross-contamination, but are usually only suitable for the visible region. It should be noted that the path length accuracy and batch-to-batch variation of plastic cuvettes may not be as good as quartz or glass cuvettes, and they are not resistant to certain organic solvents.
- Path Length Selection
According to the Beer-Lambert Law (A=ϵbc), absorbance is directly proportional to the path length. By choosing cuvettes with different path lengths, the absorbance of the sample can be effectively adjusted to fall within the optimal measurement range.
- Standard Path Length (10 mm): This is the most commonly used path length, and the vast majority of analytical methods are based on it.
- Short Path Length (e.g., 5 mm, 2 mm, 1 mm): When the sample concentration is very high and dilution is inconvenient or would introduce errors, using a short path length cuvette can effectively reduce the absorbance value.
- Long Path Length (e.g., 20 mm, 50 mm, 100 mm): When the sample concentration is extremely low and the signal is weak, using a long path length cuvette can multiply the absorbance signal, thereby improving the sensitivity and accuracy of the measurement.
- Correct Use and Cleaning
This is the most basic but most easily overlooked step.
- Handling: A cuvette typically has four sides, two of which are transparent optical surfaces, and the other two are frosted non-optical surfaces. When handling, fingers should only touch the frosted surfaces. Never touch the optical surfaces to avoid leaving fingerprints or grease, which would affect light transmission.
- Cleaning: Before each measurement, the optical surfaces must be cleaned with a special lint-free lens tissue or cloth, moistened with a suitable solvent (such as ethanol or a solvent compatible with the sample), and wiped gently in one direction to ensure they are clean and scratch-free.
- Placement Direction: Although high-quality cuvettes have very small tolerances, for the highest precision, it is good practice to always place the cuvette in the sample holder in the same orientation. Cuvettes usually have a mark; ensure this mark faces the same direction each time (e.g., towards the light source). This minimizes errors caused by minor optical non-uniformities in the cuvette itself.
- Paired Use: When performing high-precision double-beam measurements, it is recommended to use “matched pair” cuvettes with strictly matched path lengths and optical properties for the reference and sample, respectively, to eliminate differences between the cuvettes.
- Filling and Maintenance: The solution should be filled to about 2/3 to 4/5 of the cuvette’s height, ensuring the liquid level is above the center of the light path. Avoid heating cuvettes over a flame or in a high-temperature oven. Highly corrosive solutions (e.g., strong alkalis that corrode quartz and glass) should not be stored in them for long periods.
Table 6.1: Cuvette/Sample Cell Selection Guide
| Measurement Wavelength | Sample Type | Sample Concentration | Recommended Material | Recommended Path Length | Notes |
| UV Region (< 320 nm) | Clear solution | Any | Quartz | Select based on concentration | Must use quartz material; glass or plastic is opaque in this region. |
| Visible Region (> 320 nm) | Clear solution | Any | Quartz, Optical Glass, Plastic | Select based on concentration | Glass cuvettes are cost-effective; disposable plastic cuvettes avoid cross-contamination but check solvent compatibility. |
| Any Wavelength | High-concentration sample | Absorbance > 2.0 A | Quartz or Glass | Short path length (1 mm, 2 mm, 5 mm) | Avoids errors from sample dilution by measuring the stock solution directly. |
| Any Wavelength | Low-concentration sample | Absorbance < 0.1 A | Quartz or Glass | Long path length (20 mm, 50 mm, 100 mm) | Significantly increases measurement sensitivity for trace analysis. |
| Any Wavelength | Corrosive sample | Any | Quartz | Standard or special path length | Confirm if the sample corrodes quartz (e.g., strong alkali, hydrofluoric acid). Avoid using glued cuvettes. |
| Any Wavelength | Micro-volume sample (< 50 µL) | Any | – | Micro-volume path length | Use a micro-volume spectrophotometer (e.g., NanoDrop) or dedicated micro/ultra-micro cuvettes. |
6.3. Common Troubleshooting
- Abnormal Spectrum (distorted peak shape, ghost peaks, peak position drift):
Possible Causes: Impure or incorrect solvent choice (solvent itself absorbs); sample degradation or chemical reaction under light exposure; sample concentration too high causing spectral saturation; incorrect instrument wavelength calibration.
- Uneven or Severely Drifting Baseline:
Possible Causes: Light source not fully warmed up (especially deuterium lamp); sample compartment lid not closed properly, causing light leaks; drastic changes in ambient temperature; mismatched, unclean, or inconsistently oriented reference and sample cuvettes; dirt in the optical path of a double-beam instrument.
- Poor Repeatability (large fluctuations in readings for the same sample):
Possible Causes: Inaccurate pipetting leading to inconsistent sample volume in the cuvette; non-homogeneous sample with undissolved particles; air bubbles in the solution; unclean cuvette exterior or inconsistent placement orientation; volatile sample.
Chapter 7: Conclusion and Final Purchasing Checklist
After a comprehensive analysis from theory to technology and from application to market, we have built a systematic decision-making framework for you. The final step is to translate this knowledge into concrete actions to make the final, wise purchasing decision.
7.1. Summary: Building Your Custom Purchasing Decision Matrix
To quantify and organize the complex selection process, it is highly recommended that you create a personalized purchasing decision matrix. This is a weighted scoring table that can help you objectively compare different candidate instruments.
Steps to Build:
- Create a Candidate List: Based on the analysis in the previous chapters and your budget, select 2-4 candidate instrument models that best meet your needs (e.g., one high-end international model, one mid-range international model, and one or two HINOTEK models).
- List Key Consideration Factors: In the first column of the table, list all the factors that are most important to your laboratory. This should include not only technical parameters but also other important aspects. For example:
Core Performance: Stray light, spectral bandwidth, photometric range, baseline stability, etc.
Application Match: Does it have micro-volume detection? Does it support Peltier temperature control? Is the accessory ecosystem comprehensive?
Software & Compliance: How user-friendly is the software? Are the data processing functions powerful? Does it support 21 CFR Part 11?
Brand & Service: What is the brand’s reputation? What is the after-sales service response speed and quality? Is there a local application support team?
Cost: Purchase price of the main unit, accessory prices, consumable costs, annual maintenance contract fees. - Assign Weights: For each consideration factor, assign a weight (e.g., from 1 to 10) based on its importance to your lab’s work. For example, for a pharmaceutical QC lab, the weight for “Software Compliance” might be 10, while for a teaching lab, it might be only 2; conversely, the weight for “Host Price” might be as high as 9 in a teaching lab.\
- Score and Calculate: For each candidate instrument, score it on each consideration factor (e.g., 1-5 points). Then multiply the score for each factor by its weight to get a weighted score. Finally, add up all the weighted scores to get a total score for each instrument.
Although this decision matrix cannot replace professional judgment, it forces you to systematically think about your real needs and translate vague feelings into clear, comparable data, thereby greatly improving the objectivity and scientific basis of your decision.
7.2. The Ultimate Purchasing Checklist
Use the following checklist throughout the procurement process to ensure no critical steps are missed.
Phase 1: Needs Analysis and Preliminary Research
[ ] Define Core Applications: Have you clearly defined the lab’s main applications for the present and the next 2-3 years (e.g., life sciences, materials, pharma QC)?
[ ] Assess Sample Characteristics: Have you fully evaluated the sample types (liquid/solid/powder), concentration range, volume, and photosensitivity/thermosensitivity?
[ ] Determine Performance Bottom Line: Have you identified the non-negotiable key performance indicators based on your applications (e.g., must be double-beam, stray light must be below a certain value, must have Peltier temperature control)?
[ ] Set Budget Range: Have you determined the overall budget, including the main unit, necessary accessories, and the first year’s maintenance contract?
[ ] Complete Initial Market Screening: Have you selected 2-4 target brands and series based on the above information?
Phase 2: Technical Evaluation and Solution Comparison
[ ] Request Detailed Technical Specification Sheets: Have you requested and carefully compared the detailed technical parameters of the candidate instruments from each vendor?
[ ] Request an On-site Demonstration (Demo): If possible, would you prefer the supplier to bring the instrument to your lab for an on-site demo using your actual samples, or purchase a trial unit first?
[ ] Thoroughly Examine the Software System: During the demo, have you personally operated the software to evaluate its ease of use, data processing workflow, and reporting functions? For regulated industries, have you verified the completeness of its 21 CFR Part 11 features?
[ ] Evaluate Accessory Compatibility and Expandability: Have you confirmed with the vendor that the accessories you may need in the future (e.g., integrating sphere, autosampler) are fully compatible with the chosen main unit, and do you know their prices?
[ ] Consult Existing Users: Have you contacted peers who are already using these instruments through academic conferences, industry communities, etc., to get their real user feedback?
Phase 3: Business Negotiation and Contract Signing
[ ] Obtain a Formal Quotation: Does the quotation clearly list the detailed configuration and price of the main unit, all accessories, software, computer workstation, and consumables package?
[ ] Clarify Warranty Terms: How long is the standard warranty period (usually 1 year)? What does the warranty cover?
[ ] Negotiate Training Plan: Does the vendor provide manual and operation video? Are the content and duration of the training sufficient for the lab’s needs?
[ ] Confirm After-Sales Service Details: What is the standard response time for instrument servicing? Are replacement parts shipped free of charge?
[ ] Sign the Formal Contract: Does the contract include all agreed-upon terms, including package list, delivery time, payment method?
Phase 4: Installation, Acceptance, and Training
[ ] Prepare Installation Environment: Have you prepared a suitable installation site according to the vendor’s requirements (stable power supply, temperature, humidity, and a workbench free from strong vibrations and electromagnetic interference)?
[ ] Perform Installation Qualification (IQ): After the instrument arrives, has the vendor’s engineer completed the installation according to standard procedures and confirmed that all hardware, software, and accessories match the order?
[ ] Perform Operational Qualification (OQ): Has the engineer used certified standard materials (e.g., holmium oxide solution, potassium dichromate solution) to test the instrument’s core performance (wavelength accuracy, photometric accuracy, stray light, resolution) on-site and provided a report showing that the tests passed?
[ ] Complete Operator Training: Have all relevant personnel in the lab received comprehensive training on operation and routine maintenance and can they perform basic measurements independently?
[ ] Archive All Documents: Have you properly stored all documents related to the instrument, including the contract, packing list, IQ/OQ reports, user manuals, and certificates of standard materials?
By following this detailed guide and checklist, you will be able to confidently navigate the complex process of purchasing a UV-Vis spectrophotometer and select a powerful analytical tool for your laboratory that not only meets current needs but also supports future development.