A Foundational Overview of Flame Photometer
Defining Flame Photometry: A Cornerstone of Atomic Emission Spectroscopy
 |
Flame Photometry, more formally known as Flame Emission Spectroscopy (FES), is a well-established analytical technique within the broader field of atomic emission spectroscopy (AES). It is a powerful method used in inorganic chemical analysis to determine the concentration of specific metal ions within a liquid sample. The technique is particularly suited for the analysis of alkali metals (Group of the periodic table) and alkaline earth metals (Group 2), which are easily excited to emit light even in the relatively low temperatures of a flame. The most commonly analyzed elements include Sodium (Na), Potassium (K), Lithium (Li), Calcium (Ca), and Barium (Ba).
The analysis provides both qualitative and quantitative information. The characteristic color or specific wavelength of the light emitted from the flame identifies which element is present, while the intensity of that light is proportional to the element’s concentration in the sample. This dual capability makes it a versatile tool for a wide range of scientific and industrial applications.
The Core Principle: How Elements Create Light in a Flame
The fundamental principle of flame photometry can be visualized with a simple analogy: tossing commercially available color-changing packets into a campfire. These packets contain various metal salts, and as they burn, the flame erupts into a display of vibrant colors—green from copper, red from strontium, and purple from potassium. A flame photometer operates on this same basic phenomenon but quantifies it with high precision.
The process unfolds through a series of distinct physical steps at the atomic level :
|
|
- Aspiration and Nebulization: A liquid sample is drawn through a fine capillary tube into a nebulizer. Here, a high-velocity stream of gas (the oxidant, typically air) flows over the tip of the tube, creating a pressure differential (the Venturi effect) that transforms the liquid into a fine, uniform mist or aerosol.
- Desolvation and Vaporization: This aerosol is mixed with a fuel gas and carried into the flame. The intense heat of the flame instantly evaporates the solvent (e.g., water), leaving behind microscopic, solid particles of the metal salt. These solid particles are then vaporized into a gaseous state.
- Atomization: The thermal energy of the flame continues to act on the gaseous salt molecules, breaking them apart (dissociating them) into their constituent neutral, ground-state atoms. For example, a gaseous molecule of sodium chloride (NaCl) is broken down into separate Na and Cl atoms.
- Excitation: These free, ground-state atoms absorb thermal energy from the flame. This absorbed energy causes their outermost valence electrons to jump from their stable, low-energy orbital (the ground state) to a higher, unstable energy level (the excited state).
- Emission: The excited state is inherently unstable. The electrons almost instantaneously fall back to their original ground state to regain stability. As they do, they release the previously absorbed energy in the form of photons—particles of light. The energy of each emitted photon corresponds precisely to the energy difference between the excited and ground states, which is a unique and fixed characteristic for each element.
This emitted light has a specific wavelength, which we perceive as color. For instance, sodium atoms consistently emit light at a primary wavelength of 589 nm, producing a characteristic bright yellow flame. Potassium emits a lilac or pale violet color at 766 nm. The intensity of this emitted light—the number of photons released per unit of time—is directly proportional to the number of atoms of that element present in the flame. This relationship forms the basis for quantitative analysis.
The relationship between emission intensity (I) and the concentration of the element (c) can be described by the Scheibe-Lomakin equation, I=k×cn, where k is a constant related to experimental conditions and n is a factor related to self-absorption. For the low concentrations typically used in flame photometry,
n is approximately 1, simplifying the relationship to a linear one: I=k×c. This linearity allows for straightforward calibration and measurement.
A Brief History: From Early Observations to a Modern Analytical Workhorse
The scientific roots of flame photometry extend back centuries. As early as 1556, the German metallurgist Georgius Agricola noted the qualitative use of “the colour of fumes” to identify different ores, one of the first documented observations of flame-induced emission. However, the scientific understanding remained dormant for nearly two centuries until Isaac Newton’s foundational work on light and spectra in the early 1700s.
The 19th century saw an explosion of activity. In the 1820s, John Herschel studied the emissions from an alcohol lamp, and later, William Fox Talbot noted that different salts produced different flame colors, suggesting it as a method of chemical analysis. However, the true pioneers credited with establishing analytical spectrometry are Robert Bunsen (inventor of the iconic Bunsen burner) and Gustav Kirchhoff. In the mid-1800s, they systematically demonstrated that the wavelengths of light emitted from a flame were characteristic of the elements present, laying the groundwork for all modern atomic spectroscopy.
The first instrument that could be considered a true flame photometer was developed in 1873 by Champion, Pellet, and Grenier. They constructed a device that used two flames—one for a standard solution and one for an unknown—and a spectroscope to quantitatively measure sodium content in plant ash with impressive accuracy for the time. Another crucial innovation came from Gouy in 1877, who designed the pneumatic nebulizer to introduce a controlled amount of sample into the flame, dramatically improving precision.
Despite these early developments, the flame photometer’s most impactful moment arrived in the 1940s, where it became the “engine of nephrology”. Before its advent, measuring electrolytes like sodium and potassium in bodily fluids was a complex, arduous process. The flame photometer made these measurements simple, rapid, and routine for the first time. This technological leap, championed by figures like John P. Peters at Yale University, enabled a deeper understanding of water and electrolyte physiology, fostering the growth of nephrology as a medical specialty and making the diagnosis of conditions like hyponatremia and SIADH possible. This history underscores a critical point: the instrument’s enduring value is not just in its technical capability but in its proven ability to solve real-world, critical analytical challenges, particularly in the clinical laboratory. From these foundational applications, its use expanded, with companies like Beckman Instruments introducing more advanced models in the 1970s, leading to the sophisticated, automated instruments available today.
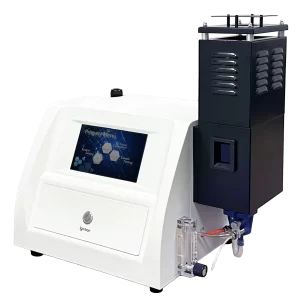
The Anatomy of a Flame Photometer: A Component-by-Component Breakdown
The Complete Signal Path: A Sample’s Journey from Solution to Data
To understand how a flame photometer functions, it is useful to trace the journey of a sample from a beaker to a final data point on a screen. This process can be broken down into five fundamental operational stages: sample preparation, atomization, light emission, detection, and quantification.5 Each stage is handled by a specific set of components working in concert to produce an accurate and reliable measurement.
The Flame Source & Burner System: The Engine of Atomic Excitation
|
|
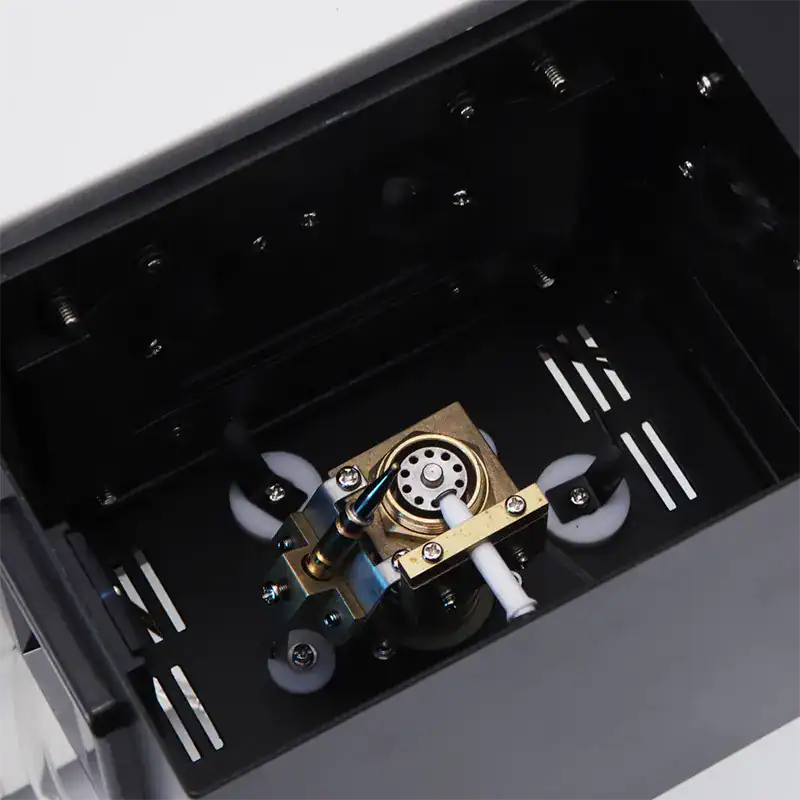
The heart of the instrument is the burner, which generates a flame with a stable and constant temperature. This stability is paramount, as fluctuations in flame temperature directly impact the number of atoms excited and, consequently, the intensity of the emitted light, affecting the accuracy of the results.
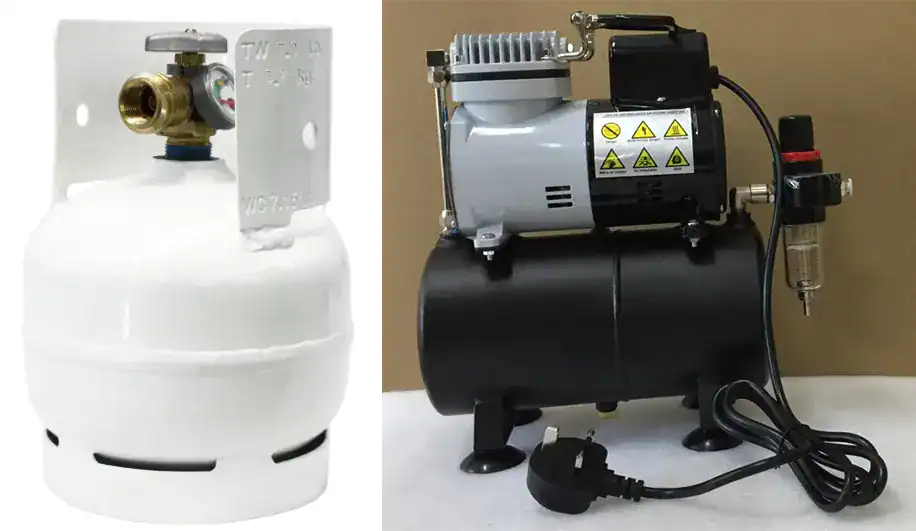
The flame is produced by mixing a fuel gas with an oxidant. Common fuel gases include propane, butane, or natural gas, while the oxidant is typically compressed air.16 For certain applications requiring higher temperatures to analyze less easily excited elements like calcium, a hotter fuel such as acetylene may be used with air or oxygen. The choice of fuel and oxidant determines the flame’s temperature, which can range from approximately 1700°C for natural gas-air to over 3000°C for acetylene-oxygen.
|
|
Two primary types of burners are used:
- Total Consumption Burner: In this simpler design, the sample, fuel, and oxidant are all fed directly and separately into the flame. It is less efficient and produces a more turbulent flame.
- Premix Burner (Lundegardh type): This is the more common and preferred design in modern instruments. The sample aerosol is mixed with the fuel and oxidant gases in a mixing chamber before reaching the burner head. This pre-mixing results in a more homogeneous, laminar (non-turbulent), and stable flame, which is essential for high-precision analysis.
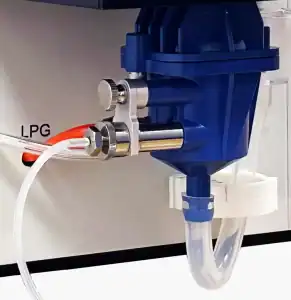
The Nebulizer & Mixing Chamber: Creating the Analytical Aerosol
Before the sample can be analyzed in the flame, it must be converted from a liquid into a fine, gaseous aerosol. This is the critical function of the nebulizer and mixing chamber.
|
|
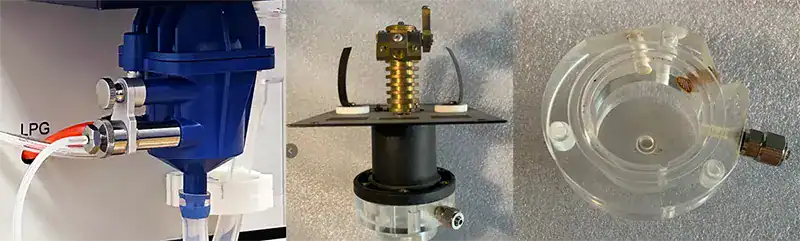
- Nebulizer (Aspirator): The nebulizer uses the Bernoulli Principle to create the sample mist. A high-velocity stream of compressed air (the oxidant) is directed across the tip of a narrow capillary tube that is immersed in the sample solution. This creates a low-pressure zone that draws the liquid up the capillary and sheers it into microscopic droplets, forming a fine, consistent aerosol. The quality and consistency of this aerosol are vital for reproducible results.
- Mixing Chamber: The aerosolized sample then enters a mixing chamber. Here, it is thoroughly combined with the fuel gas. Larger droplets may be removed from the stream by impacting baffles or walls, ensuring that only the finest, most uniform droplets are carried into the burner. This process guarantees a stable and homogeneous introduction of the sample into the flame.
The Optical System: Isolating an Element’s Signature Wavelength
Once the atoms in the flame are excited and emit light, the optical system is responsible for isolating the specific wavelength characteristic of the target element while rejecting all other unwanted light, such as background emissions from the flame itself or light from other elements in the sample.
The optical path typically begins with a system of mirrors and lenses that collect the light emitted from the flame and focus it toward the wavelength selector. The design of this selector is a key differentiator between instrument types and directly impacts performance and cost. There are two main approaches:
- Simple Color Filters: In basic flame photometers, a simple optical filter is used. This filter is designed to transmit a narrow band of wavelengths corresponding to the emission line of a specific element (e.g., a 589 nm filter for sodium) while blocking others. This approach is analogous to a colorimeter. It is simple and cost-effective but offers lower resolution and can be more susceptible to spectral interference if another element emits light within the filter’s passband.
- Monochromator: More advanced instruments utilize a monochromator, which employs a prism or, more commonly, a diffraction grating to spatially separate the incoming light into its constituent wavelengths, much like a rainbow. A narrow exit slit then allows only the precise wavelength of interest to pass through to the detector. This approach is analogous to a spectrophotometer and provides superior resolution, greater flexibility in wavelength selection, and a much better ability to minimize spectral interferences.
The choice between a filter and a monochromator represents a fundamental trade-off. For routine, single-element analysis where the sample matrix is simple (e.g., Na and K in clinical samples), a filter-based system is often sufficient and highly cost-effective. Because of this, HINOTEK’s Flame Photometer use filter. For research applications or the analysis of complex matrices with potential spectral overlaps, the superior performance of a monochromator is essential.
Table 1: Characteristic Emission Wavelengths and Flame Colors of Key ElementsThis table provides a quick reference for the fundamental emission characteristics of the elements most commonly analyzed by flame photometry.
| Element | Symbol | Emission Wavelength (nm) | Observed Flame Color |
| Sodium | Na | 589 | Bright Yellow |
| Potassium | K | 766 | Lilac (Pale Violet) |
| Lithium | Li | 670 | Red |
| Calcium | Ca | 622 | Orange-Red |
| Barium | Ba | 554 | Lime Green |
The Detector & Readout System: Translating Light into Quantitative Results
The final stage of the analysis involves converting the isolated light into a measurable signal and presenting it to the user.
|
|

- Photodetector: The light that passes through the filter or monochromator strikes a photodetector. This is typically a highly sensitive component like a photodiode or a photomultiplier tube (PMT). The function of the photodetector is to convert the incoming light energy (photons) into a proportional electrical current—the more intense the light, the stronger the electrical signal.
- Amplifier and Readout System: This weak electrical signal is then amplified and processed by the instrument’s electronics. In older, analog instruments, this might have been displayed on a simple galvanometer.7 However, modern flame photometers are equipped with digital systems that convert the signal into a direct concentration reading. These readings can be displayed in various user-selected units, such as ppm (parts per million), mg/L, or mmol/L for clinical applications. Advanced instruments feature large touch-screen displays, onboard software for storing calibration curves and results, and connectivity ports (USB, RS-232) for transferring data to a computer for further analysis and reporting, often with software.
|
|
 |

A Spectrum of Applications: Where Flame Photometry Excels
The utility of flame photometry spans a wide range of industries and scientific disciplines. Its success in these diverse fields is not due to being a universal analytical tool, but rather a highly specialized one. The common thread across all applications is the need for fast, reliable, and cost-effective quantification of a select group of alkali and alkaline earth metals. The instrument’s value proposition is its mastery of this specific niche.
Clinical Diagnostics: A Vital Tool for Monitoring Bodily Electrolytes
The clinical laboratory is arguably the most historically significant and enduring application area for flame photometry. The instrument is indispensable for measuring the concentrations of key electrolytes—primarily sodium (Na+), potassium (K+), and lithium (Li+)—in various biological fluids, including blood serum, plasma, urine, and cerebrospinal fluid.
The medical importance of these measurements cannot be overstated. They are critical for:
- Diagnosing and Monitoring Electrolyte Imbalances: Conditions like hyponatremia (low sodium) and hyperkalemia (high potassium) can have severe health consequences, and flame photometry provides the rapid results needed for timely intervention.
- Assessing Kidney Function: Patients with kidney disorders or those undergoing dialysis rely on regular monitoring of their electrolyte levels to manage their condition effectively.
- Therapeutic Drug Monitoring: Lithium salts are used as a mood stabilizer in the treatment of bipolar disorder. Flame photometry is used to monitor the concentration of lithium in the patient’s blood to ensure it remains within the narrow therapeutic window, avoiding sub-therapeutic levels or toxic side effects.
- General Health Screening: Electrolyte panels are a routine part of metabolic assessments to diagnose and monitor a variety of conditions, including dehydration and endocrine disorders like the syndrome of inappropriate antidiuretic hormone secretion (SIADH).
In many of these clinical applications, lithium is also used as an “internal standard”. A known concentration of lithium is added to all samples and standards. Because lithium is not naturally present in significant amounts in the body, its signal can be used to correct for minor variations in flame stability or sample aspiration rate, thereby improving the accuracy and precision of the sodium and potassium measurements.
Agriculture & Environmental Science: Assessing Soil Health and Water Quality
Flame photometry plays a crucial role in safeguarding our food supply and environment.
- Agriculture and Soil Science: The fertility of soil is directly linked to the availability of essential nutrients. Flame photometry is widely used to analyze soil extracts and fertilizers to determine the concentration of potassium (K) and calcium (Ca). Potassium is a primary macronutrient vital for overall plant health, disease resistance, and crop yield. By providing farmers and agronomists with accurate data on soil nutrient levels, the technique helps optimize fertilizer application, preventing both nutrient deficiencies and wasteful, environmentally harmful overuse.
- Environmental Monitoring: Protecting water resources requires constant monitoring. Flame photometers are used to measure the concentration of sodium, potassium, and other metal ions in a wide array of water samples, including drinking water, rivers, lakes, rainwater, industrial effluents, and wastewater. This data is essential for assessing pollution levels, ensuring compliance with environmental regulations, controlling water treatment plant processes, and protecting both public health and aquatic ecosystems.
Food & Beverage Industry: Ensuring Quality Control and Nutritional Accuracy
In the food and beverage industry, flame photometry is a key quality control (QC) tool for analyzing the mineral content of products. It is routinely used to determine the concentration of sodium and potassium in products such as fruit juices, soft drinks, dairy products, alcoholic beverages, and processed foods.
This analysis serves two primary purposes:
- Quality Control: Ensuring product consistency from batch to batch.
- Nutritional Labeling: Verifying that the mineral content listed on the nutritional facts label is accurate. This is particularly important for products making specific health claims, such as “low sodium,” where regulatory compliance is mandatory. The speed and reliability of flame photometry make it ideal for the high-throughput demands of a production environment.
Industrial Processes: The Role in Cement, Glass, and Chemical Manufacturing
Flame photometry is a workhorse instrument in several heavy industries where the concentration of alkali metals is a critical quality parameter.
- Cement Manufacturing: This is one of the most important industrial applications. The alkali content—specifically sodium oxide (Na2O) and potassium oxide (K2O)—in Portland cement must be tightly controlled. If the alkali content is too high, it can lead to a destructive alkali-silica reaction (ASR) with certain types of aggregates over time, causing the concrete to expand, crack, and ultimately fail. Flame photometry is the standard reference method (e.g., ASTM C114) used in cement plant laboratories for the rapid and routine quality control of both clinker and finished cement, ensuring the long-term durability of concrete structures.
- Other Industries: The technique is also applied in the manufacturing of glass, ceramics, and refractory materials to control the quality of raw materials and ensure the desired properties of the final product. In the chemical and pharmaceutical industries, it is used for the QC of raw materials, process solutions, and finished goods to verify their composition and purity.
Performance Analysis: Advantages, Disadvantages, and Navigating Interferences
No analytical technique is perfect for every situation. A thorough understanding of a method’s strengths, weaknesses, and potential pitfalls is essential for its effective application. The performance of flame photometry is intrinsically linked to its core design: the use of a relatively low-temperature flame as an excitation source. This design choice is a double-edged sword, directly responsible for both its key advantages and its most significant limitations.
Key Advantages: Why Flame Photometry Remains a Go-To Technique
Despite the availability of more technologically advanced instruments, flame photometry maintains its place in modern laboratories due to a powerful combination of practical benefits.
- Cost-Effectiveness: This is perhaps its most compelling advantage. Flame photometers are significantly less expensive to purchase and operate than more complex atomic spectroscopy techniques like Atomic Absorption Spectroscopy (AAS) and especially Inductively Coupled Plasma – Optical Emission Spectrometry (ICP-OES). The instrumentation is simpler, and it does not require costly consumables like hollow-cathode lamps (for AAS) or large quantities of expensive, high-purity argon gas (for ICP-OES).
You can even get a Hinotek flame photometer for more less than US$700. - Speed and High Throughput: The analysis is exceptionally fast, with stable readings often achieved in seconds. This makes it ideal for routine QC and clinical environments where rapid turnaround is critical. Modern, automated instruments can achieve sample throughputs of up to 300 measurements per hour, a rate that is highly competitive.
- Simplicity and Ease of Use: The operational principle and the instrument itself are straightforward. This makes the technique accessible to technicians and operators without requiring extensive, specialized training. Modern instruments further enhance this with intuitive software, automated calibration routines, and built-in safety features that minimize the potential for user error.
- High Sensitivity and Selectivity for Target Elements: For its specific niche—the alkali and alkaline earth metals—flame photometry is both highly sensitive and selective. It can reliably detect these elements at trace levels, often in the parts-per-million (ppm) and, in some cases, parts-per-billion (ppb) range, which is more than sufficient for its primary applications.
Inherent Limitations: Understanding the Boundaries of the Technique
The very simplicity that makes flame photometry advantageous also defines its limitations.
- Limited Range of Elements: This is the most significant disadvantage. The energy provided by a low-temperature flame (e.g., propane-air at ~1900°C) is insufficient to excite the atoms of most elements in the periodic table. The technique is therefore largely confined to the easily excited alkali and alkaline earth metals. It cannot be used for the direct determination of transition metals, noble metals, halides (like chlorine), or inert gases, which require much higher energy sources like a plasma torch.
- No Molecular Information: Flame photometry measures the total concentration of an element in a sample. It provides no information about the original molecular structure or chemical form (speciation) in which that element existed. For example, it can measure the total calcium concentration, but it cannot distinguish between calcium chloride and calcium carbonate.
- Liquid Samples Only: The standard method of sample introduction via a nebulizer requires the sample to be in a liquid solution. Solid samples, such as soil, food, or cement, must undergo a potentially lengthy and labor-intensive preparation process involving ashing, acid digestion, and filtration before they can be analyzed.
- Destructive Analysis: The sample is aspirated into the flame and consumed during the analysis. While this is irrelevant for most applications where the sample is abundant (e.g., wastewater, blood serum), it could be a prohibitive factor if the sample is extremely precious or available only in minute quantities.
- Susceptibility to Interferences: The low-energy flame environment, while simple, makes the technique prone to several types of interferences that can affect the accuracy of the results if not properly managed.
A Practical Guide to Managing Interferences
Accurate analysis with flame photometry requires the user to be aware of and actively mitigate potential interferences. These can be categorized into four main types.
- Spectral Interference: This occurs when the emission from an unwanted species overlaps with the emission from the analyte. This can come from another element in the sample emitting at a very close wavelength or from broad-band emission from molecules or particulates in the flame itself. For example, a strong emission from strontium can potentially interfere with the measurement of lithium, as their emission bands are close.
- Mitigation: The most effective solution is to use an instrument with a high-resolution monochromator instead of a simple filter to better isolate the analyte’s specific wavelength. Analyzing a “blank” solution (containing everything except the analyte) allows for the subtraction of constant background emission from the flame and sample matrix.
- Chemical Interference (or Vaporization Interference): This is one of the most common issues in flame photometry. It happens when a chemical component in the sample matrix reacts with the analyte in the flame to form a compound that is more or less volatile than the analyte’s standard form.
- The Problem: The most frequent example is the presence of anions like phosphate (PO43−), sulfate (SO42−), or aluminate in a sample containing calcium. In the flame, these anions can form highly stable, non-volatile compounds (e.g., calcium phosphate, Ca3(PO4)2). These stable compounds do not easily dissociate into free calcium atoms, meaning fewer Ca atoms are available for excitation. This results in a depressed, artificially low signal for calcium.
- Mitigation: This effect can be overcome by adding a “releasing agent” to both the samples and standards. A common releasing agent is a high concentration of lanthanum or strontium chloride. These agents work by preferentially reacting with the interfering anion (e.g., phosphate), “releasing” the analyte atom to be atomized and excited normally. Alternatively, using a hotter flame (e.g., acetylene-air) can provide enough energy to break down these stable compounds.
- Ionization Interference: This interference occurs when the flame is hot enough to not just excite a neutral atom, but to strip an electron from it, creating an ion.
- The Problem: An ion has a completely different set of energy levels and emission wavelengths than its parent neutral atom. Since the instrument is set to measure the emission from the neutral atom, any atom that becomes ionized is effectively lost from the measurement, leading to a depressed signal. This is most significant for alkali metals like sodium and potassium, which have low ionization energies and are therefore easily ionized, especially in hotter flames.
- Mitigation: The solution is to add an “ionization suppressor” or “radiation buffer” to all samples and standards. This is typically a solution containing a very high concentration of another, even more easily ionized element, such as cesium or potassium (if potassium is not the analyte). The high concentration of the suppressor floods the flame with electrons, which, according to Le Châtelier’s principle, shifts the ionization equilibrium of the analyte back towards its neutral atomic state, minimizing ionization and restoring the signal.
- Physical Interference: This category relates to differences in the physical properties of the sample solutions (e.g., viscosity, surface tension, density) that alter the rate of nebulization and sample transport into the flame.
- The Problem: A sample that is more viscous than the calibration standards will be aspirated more slowly, delivering less analyte to the flame per unit of time and causing an erroneously low reading. This is a common issue in samples with high concentrations of sugar, protein, or salts.
- Mitigation: The most common strategies are to dilute all samples to minimize the differences in physical properties, or to carefully match the matrix of the calibration standards to the matrix of the samples. For complex and unknown matrices, the “method of standard additions” can be employed.
Flame Photometry in Context: A Comparative Analysis of Atomic Spectroscopy Techniques
Choosing the right analytical instrument requires understanding not only its individual capabilities but also how it compares to alternative technologies. For elemental analysis, flame photometry (FES) primarily competes with Atomic Absorption Spectroscopy (AAS) and Inductively Coupled Plasma – Optical Emission Spectrometry (ICP-OES). The decision between these techniques is not about finding the single “best” instrument, but about identifying the one that is the fittest for a specific purpose. Flame photometry’s enduring relevance is a clear demonstration of the value of specialization in a world of increasingly generalized technologies.
Flame Emission (FES) vs. Atomic Absorption (AAS)
The core difference between FES and AAS lies in what they measure. FES measures the light emitted by atoms that have been thermally excited by the flame, whereas AAS measures the light absorbed by non-excited, ground-state atoms. In AAS, a light source specific to the element being tested (a hollow-cathode lamp) shines a beam through the flame. The ground-state atoms in the flame absorb this light, and the instrument measures the decrease in light intensity.
This fundamental difference has significant performance implications:
- Elemental Range: In any given flame, the population of atoms in the ground state is orders of magnitude larger than the population in the excited state. Because AAS measures the large population of ground-state atoms, it is applicable to a much wider range of elements (around 70) than conventional FES, which relies on the small fraction of atoms that get excited.
- Sensitivity: For the easily excited alkali metals like Na and K, a simple flame provides enough energy to create a significant population of excited atoms. For these specific elements, FES is often just as sensitive as, if not more sensitive than, Flame AAS and is frequently the preferred method.
- Instrumentation and Cost: FES instrumentation is generally simpler and less expensive, as it does not require the element-specific hollow-cathode lamps needed for AAS. Recognizing the utility of both techniques, many modern AAS instruments are designed to operate in an “emission mode,” allowing them to function as a flame photometer for Na and K analysis without an external lamp.
Flame Emission (FES) vs. Inductively Coupled Plasma – Optical Emission Spectrometry (ICP-OES)
Both FES and ICP-OES are emission techniques, but they differ dramatically in their excitation source. FES uses a chemical flame with temperatures ranging from 1700–2300°C. ICP-OES uses an electrically-generated argon plasma, a state of matter reaching incredibly high temperatures of 6,000–8,000 K. This difference in energy is the source of all major performance distinctions.
- Elemental Range and Throughput: The extremely hot plasma in an ICP-OES can efficiently excite over 70 elements, making it a powerful, true multi-element analysis tool. A single ICP-OES run can simultaneously quantify nearly every metal on the periodic table. FES is limited to its small group of easily excited elements.
- Detection Limits: ICP-OES is significantly more sensitive. Its detection limits are typically in the low parts-per-billion (ppb) range (1-10 ppb), whereas FES operates more comfortably in the parts-per-million (ppm) to high-ppb range. For ultra-trace analysis, ICP-OES is far superior.
- Interferences: The high-temperature plasma of an ICP-OES is so effective at atomizing samples that it virtually eliminates the chemical and vaporization interferences that can plague FES. However, because so many elements are emitting light simultaneously, ICP-OES can suffer from more complex spectral interferences, requiring sophisticated optics and software to resolve.
- Cost and Complexity: This superior performance comes at a steep price. An ICP-OES system is substantially more expensive to purchase (typically $60,000 to $100,000 USD) compared to a flame photometer (often under $20,000 USD). The operating costs are also much higher, driven primarily by the continuous consumption of large quantities of expensive, high-purity argon gas. ICP-OES is also a more complex instrument that requires a higher level of operator expertise to run and maintain.
Making the Right Choice: Decision Criteria for Your Laboratory’s Needs
The choice of instrument is a trade-off between performance, scope, and cost. If a laboratory’s primary need is the routine, high-throughput analysis of only Na, K, and Li in clinical samples or cement, purchasing a high-performance ICP-OES would be unjustifiable overkill. The flame photometer is the more economical, efficient, and perfectly suited tool for the job. Conversely, a research lab needing to screen environmental samples for a wide range of unknown heavy metals at trace levels would find a flame photometer completely inadequate for their needs and would require an ICP-OES or ICP-MS.
Table 2: FES vs. AAS vs. ICP-OES: A Head-to-Head Comparison
This table summarizes the key characteristics of the three major atomic spectroscopy techniques to aid in selecting the most appropriate instrument for a given application.
| Feature | Flame Photometer | Atomic Absorption Spectrophotometer (AAS) | Inductively Coupled Plasma (ICP-OES) |
| Principle | Measures light emitted by thermally excited atoms. | Measures light absorbed by ground-state atoms. | Measures light emitted by atoms excited in a plasma. |
| Excitation Source | Chemical Flame (Propane/Air, etc.) | Chemical Flame (Acetylene/Air, etc.) | Argon Plasma |
| Temperature | Low (~1700–2300°C) | Moderate (~2100–2400°C) | Very High (~6000–8000 K) |
| No. of Elements | Limited (~5-10 easily excited elements) | Broad (~70 elements) | Very Broad (>70 elements) |
| Typical Detection Limits | ppm to high ppb | ppm to mid ppb | mid-to-low ppb |
| Key Interferences | Chemical (e.g., phosphate), Ionization | Chemical, Spectral (from matrix) | Spectral (from numerous emission lines) |
| Multi-Element Capability | Simultaneous with multi-channel models | Sequential (one element at a time) | Fully simultaneous |
| Capital Cost | Low ($) | Low-Medium ($$) | High ($$$$) |
| Operational Cost | Very Low | Low | High (Argon consumption) |
| Ideal Applications | Routine QC of Na, K, Li, Ca, Ba in clinical, cement, agriculture, food. | Analysis of specific metals in a variety of samples; good for single-element focus. | Broad environmental screening, geological analysis, multi-element research. |
The Buyer’s Guide: How to Choose the Right Flame Photometer
Selecting the right flame photometer involves more than just comparing prices. It requires a strategic assessment of your laboratory’s specific analytical needs, workflow, budget, and future growth potential. The market is not monolithic; different manufacturers offer instruments with distinct design philosophies, from all-in-one convenience to modular upgradability. Asking the right questions upfront ensures you invest in a system that will be a valuable asset for years to come.
Critical Questions to Ask Before Purchasing
Before evaluating specific models, a potential buyer should have clear answers to the following foundational questions :
- What elements do I need to analyze? Confirm that your target elements (e.g., Na, K, Ca, Li, Ba) are supported. Be wary of claims for “exotic” elements like Magnesium (Mg), which may require hotter, more complex fuel gases like acetylene and pose safety challenges.
- Do I need simultaneous analysis? Will you be measuring multiple elements in the same sample? A multi-channel instrument that detects and calibrates all elements at once will be vastly more efficient than a single-channel model that requires manual filter changes and recalibration for each element.
- What is my typical sample throughput and volume? Estimate the number of samples you run per day to determine if you need the speed of a multi-channel system or the automation of an autosampler. If your samples are precious or limited in volume, look for systems that can work with small volumes (e.g., 0.05 mL).
- What is included in the price? The “ticket price” is often not the final price. Clarify if essential components like an air compressor, software, calibration standards, and tubing are included or must be purchased separately. An internal, built-in air compressor, for example, saves bench space, reduces noise, and can improve stability compared to external units.
- What are my data and compliance requirements? Does your lab require digital records, LIMS integration, or compliance with regulations like GLP or 21 CFR Part 11? Ensure the instrument’s software and connectivity options (e.g., USB, Ethernet,.csv/.pdf export) meet these needs.
- What are the lab requirements? Consider the instrument’s physical footprint, including any external accessories. Confirm the required utilities: type of fuel gas (propane, butane, natural gas), electrical supply, and proper ventilation (a Fume Hood is often recommended).
- What level of support is available? Inquire about the manufacturer’s or distributor’s technical and application support, as well as warranty and service options. HINOTEK support email: [email protected]
Decoding Specifications: Channels, Detection Limits, Linearity, and Reproducibility
When comparing data sheets, understanding the key performance specifications is crucial.
- Channels (Single vs. Multi-channel): This specifies how many elements can be measured at once. A single-channel instrument has one detector and requires the operator to select a filter for each element, making analysis sequential. A multi-channel instrument has a dedicated filter and detector for each element (e.g., five channels for Na, K, Li, Ca, Ba), allowing for true simultaneous detection and display. This drastically reduces analysis time and eliminates the need for repeated calibrations.
- Detection Limit (LOD): This is the lowest concentration of an element that the instrument can reliably distinguish from a blank. It is a key measure of sensitivity. Look for LODs in the low-ppm or ppb range for your elements of interest.
- Linearity: This defines the concentration range over which the instrument’s output is directly proportional to the analyte concentration. A wide linear range is advantageous as it may reduce the need for sample dilution. Some elements, like sodium, are prone to self-absorption at higher concentrations, causing the calibration curve to become non-linear. Instruments with a “linearizer” feature use software to correct for this, extending the usable measurement range.
- Reproducibility (Precision) and Stability (Drift): Reproducibility measures the consistency of results for repeated measurements of the same sample and is often expressed as a percentage coefficient of variation (% CV). A low % CV (e.g., <1%) indicates high precision. Stability, or drift, measures how much the signal changes over a period of time (e.g., <1% drift in 60 minutes). High stability is a hallmark of a robust instrument with a well-regulated flame and electronics.
The Impact of Automation, Software, and Connectivity
Modern flame photometers have moved far beyond manual operation. Automation and software are no longer luxury features but essential components for efficiency, accuracy, and compliance.
- Automation: Features like automatic ignition, flame optimization, autosamplers, and automatic dilutors can transform a lab’s workflow. An autosampler allows for unattended analysis of large batches of samples, freeing up operator time and minimizing human error.17 An auto-dilutor automates the time-consuming and error-prone step of sample dilution, which is particularly useful in clinical labs.
- Software and Connectivity: User-friendly software is critical for instrument control, calibration, and data management. Look for software that can store multiple calibration curves, automatically log results with time and date stamps, and export data in common formats like.csv or.pdf for easy integration with LIMS or spreadsheets.26 For regulated environments like pharmaceutical or clinical labs, software that is compliant with 21 CFR Part 11, offering features like user administration, audit trails, and electronic signatures, is essential.
Essential Safety Features of Modern Instruments
Given that the instrument operates with an open flame and flammable gases, safety is a paramount consideration. Modern instruments incorporate multiple safety mechanisms to protect the operator and the laboratory.
- Flame Failure Detection and Automatic Gas Shutoff: This is the most critical safety feature. An optical sensor continuously monitors the flame. If the flame is accidentally extinguished for any reason (e.g., interruption of air supply, power failure), the system instantly and automatically shuts off the fuel gas supply, preventing the release of flammable gas into the lab.
- Safety Interlocks: The instrument will not attempt to ignite the flame unless all prerequisite conditions are met, such as adequate air pressure from the compressor.
- Thermally Insulated Chimney: The chimney is designed to be “cool-to-the-touch” or is well-insulated to minimize the risk of accidental burns.
- Regulated and Controlled Ignition: The ignition sequence is automated and controlled by the instrument’s firmware, ensuring a safe and reliable startup.
An Overview of Leading Manufacturers and Their Philosophies
The flame photometer market includes several key players, each with a distinct approach and target audience.
- BWB Technologies: BWB positions itself as a modern innovator focused on providing a complete, user-friendly, “all-in-one” solution. Their defining features are the inclusion of a built-in, quiet air compressor in all models and their pioneering of simultaneous five-channel detection. Their philosophy is “just add gas”—the instrument arrives with all necessary accessories and standards, simplifying the purchasing and setup process. They also offer application-specific models, such as the BWB BIO for clinical work, catering directly to specific market needs.
- Sherwood Scientific: Sherwood is a legacy brand with a strong reputation for robust and reliable instruments. Having acquired the original, highly respected Corning design, Sherwood’s philosophy is rooted in proven performance and modularity. They offer a range of single- and dual-channel instruments (e.g., Models 410, 420, 425) that allow laboratories to start with a basic unit and add capabilities like digital output, linearizers, and automation as their needs and budget grow. They have a strong, established presence in both industrial and clinical markets.
- Cole-Parmer (formerly Jenway): Cole-Parmer serves the market with a philosophy centered on providing economical, reliable, and straightforward instruments. Their photometers are often targeted at educational settings and laboratories performing routine, non-complex analyses where budget is a primary concern. They offer solid, core functionality and essential safety features without the advanced automation or multi-channel capabilities of higher-end models, making the technology accessible to a wider range of users.
- A. KRÜSS Optronic: This German manufacturer represents the high-end, high-precision segment of the market. The A. KRÜSS philosophy is focused on maximum performance, automation, and regulatory compliance for demanding industrial and pharmaceutical applications. Their FP8000 series instruments offer simultaneous multi-channel measurement, extremely high sample throughput, full automation options for 24/7 process control, and software designed for strict compliance with standards like GMP/GLP and 21 CFR Part 11.
Best Practices for Operation, Maintenance, and Troubleshooting
Owning a flame photometer is only the first step; achieving consistently accurate and reliable results depends on adhering to best practices for sample preparation, calibration, and routine maintenance. Proper care not only ensures data quality but also extends the operational life of the instrument.
A Step-by-Step Guide to Sample and Standard Preparation
The quality of your results can only be as good as the quality of your samples and standards. The cardinal rule of flame photometry is that all solutions aspirated into the instrument must be clear and free of any particulate matter, which can easily clog the fine capillary of the nebulizer.
Preparing Standard Solutions:
Since flame photometry is a relative technique, accurate calibration standards are non-negotiable. The process typically involves:
- Start with a Stock Solution: Purchase or prepare a high-concentration stock solution (e.g., 1000 ppm or 10,000 ppm) of the element of interest. These are more stable for long-term storage than low-concentration solutions.
- Use High-Purity Water: All dilutions must be made with deionized (DI) or distilled deionized (DD) water to avoid contamination from trace metals present in tap water or standard distilled water.
- Perform Serial Dilutions: Create a series of “working standards” by carefully diluting the stock solution. For example, to create a 10 ppm standard from a 1000 ppm stock, you would pipette 1 mL of the stock into a 100 mL volumetric flask and fill to the mark with DI water. This series of standards should bracket the expected concentration range of your unknown samples.
- Prepare Fresh: Low-concentration standards (<100 ppm) can degrade over time due to ionic interactions and should be prepared fresh for best results.
Preparing Blank Solutions:
The “blank” is used to set the instrument’s zero point. A common mistake is to use pure DI water as the blank. The blank solution must be a perfect matrix match to the samples, containing all the same constituents except for the element being measured. For example, if your samples were prepared by dissolving them in 10 mL of hydrochloric acid and diluting to 100 mL, your blank must also contain 10 mL of the same hydrochloric acid diluted to 100 mL. This ensures that any signal from the acid itself is subtracted, preventing matrix interference.
Preparing Samples:
- Liquid Samples (e.g., water, serum, urine): These are often the simplest to prepare. The primary step is dilution with DI water to bring the analyte concentration into the instrument’s optimal linear range.29 For clinical samples, a precise dilution using an automatic diluter is common practice.
- Solid Samples (e.g., soil, cement, food): These require a more involved digestion process. A typical procedure involves weighing a precise amount of the solid, burning it to ash in a high-temperature furnace, dissolving the resulting ash in a strong acid (like hydrochloric or nitric acid), filtering out any remaining solids, and finally, diluting the clear solution to a precise, known volume.
Calibration Procedure
Calibration must be performed every time the instrument is used and should be checked periodically during long analytical runs.87
- Warm-up and Stabilize: Turn on the instrument, air compressor, and gas supply. Ignite the flame and allow the system to warm up and stabilize for at least 15-20 minutes while continuously aspirating DI water. This ensures the burner reaches a constant temperature.7
- Set the Zero (Blank): Aspirate the prepared blank solution. Adjust the instrument controls or use the software function to set the reading to zero.7
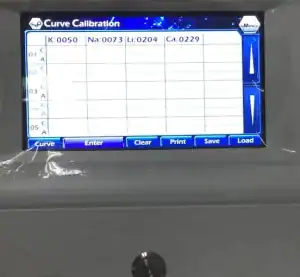
- Set the Span (Calibrate): For a simple two-point calibration, aspirate the highest-concentration standard solution and adjust the instrument’s sensitivity or “span” control until the display reads the correct value.7 For a more accurate multi-point calibration, aspirate each of the working standards in order of increasing concentration. The instrument’s software will use these points to generate a calibration curve.88
- Verify Calibration: After calibration, re-run one of the standard solutions as if it were an unknown sample to verify that the instrument reads the correct concentration.
For detail calibration procedure, please visit page: Flame Photometer Calibration
Routine Maintenance: Keeping Your Instrument in Peak Condition
Proactive maintenance is key to preventing downtime and ensuring data quality.
Daily (or Before Each Use):
- Inspect Tubing: Check all gas and air lines for cracks, kinks, or loose connections.
- Check Drain: Ensure the drain trap or ‘U’ tube is filled with DI water and functioning correctly to prevent gas from escaping.
- Flush the System: At the end of each session, aspirate DI water for at least 5-10 minutes to thoroughly flush the nebulizer, mixing chamber, and burner of any residual salts or sample matrix.
Periodic (Weekly/Monthly):
- Clean the Nebulizer: The nebulizer is the most common source of problems. Carefully clean its capillary using the fine wire provided by the manufacturer to remove any blockages. Avoid using harsh acids like HCl, which can etch the stainless steel over time; nitric acid is often preferred.
- Clean the Mixing Chamber and Burner: Disassemble and clean the mixing chamber, baffles, and burner head according to the manufacturer’s instructions. An ultrasonic bath with a recommended cleaning solution can be effective for removing stubborn deposits.
- Check Air Filter: Inspect the air compressor’s filter for dirt or moisture and clean or replace it as needed to ensure a clean air supply.
Annual:
- Schedule a preventative maintenance and service call with a manufacturer-certified technician. They will perform more in-depth checks, replace worn O-rings and seals, and verify the performance and safety of the electronics and gas handling systems.
A Guide to Common Problems and Solutions
Even with proper care, issues can arise. The following table outlines common problems, their likely causes, and recommended solutions.
Table 3: Troubleshooting Guide for Common Flame Photometer Issues
| Symptom | Probable Cause(s) | Recommended Solution(s) |
| Ignition Failure | No fuel supply or incorrect gas pressure. | Check that the gas cylinder valve is open and the regulator is set to the correct pressure. Ensure there is fuel in the cylinder. |
| No spark from igniter. | Check for loose connections to the igniter. The igniter tip may be dirty or incorrectly positioned; clean and adjust its distance from the burner head. If it still fails, the igniter may need replacement. | |
| Incorrect air-to-fuel ratio. | Adjust the fuel valve. Too little or too much fuel can prevent ignition. | |
| Unstable or Drifting Readings | Unstable flame. | Check for drafts in the room. Ensure the air compressor is providing a steady, non-pulsating air supply at the correct pressure. Check for clogs in the burner head. |
| Contaminated or blocked nebulizer/mixing chamber. | This is the most common cause. Disassemble and thoroughly clean the nebulizer, mixing chamber, and burner head. | |
| Instrument requires recalibration. | Environmental conditions (temperature, humidity) may have changed. Perform a fresh calibration. | |
| No Sample Uptake (No Signal) | Blocked sample capillary tube or nebulizer. | Disconnect the sample tube and attempt to aspirate DI water from a beaker. If it still fails, the nebulizer is clogged. Use the provided cleaning wire to carefully clear the blockage. |
| Sample is too viscous. | Dilute the sample with DI water. | |
| Inaccurate Results | Incorrectly prepared standards or blank. | Remake all standard and blank solutions carefully, using high-purity water and volumetric flasks. Ensure the blank is a matrix match to the samples. |
| Sample concentration is outside the linear range. | Dilute the sample to bring its concentration within the calibrated range of the instrument. | |
| Unmanaged interference (chemical, ionization, etc.). | Identify the source of interference. Add the appropriate releasing agent or ionization suppressor to all samples, standards, and the blank. |
Operation Manual for HINOTEK FP6410 Flame Photometer
Conclusion: The Enduring Value and Future of Flame Photometry
In the landscape of modern analytical chemistry, populated by highly complex and versatile technologies like ICP-MS and advanced chromatography, the flame photometer stands out for its elegant simplicity and focused purpose. Its core strengths—unmatched cost-effectiveness, operational simplicity, and rapid, reliable analysis for a specific suite of elements—are not relics of a bygone era but are precisely the attributes that ensure its continued and vital role in laboratories worldwide.
The instrument has proven itself indispensable in critical sectors. In clinical diagnostics, it remains a frontline tool for the life-saving measurement of electrolytes. In the cement industry, it is the established standard for ensuring the safety and durability of our infrastructure. In agriculture and food production, it is a key player in maintaining soil health and verifying nutritional quality. In all these fields, the flame photometer succeeds because it is the “right tool for the job”—an economical and efficient solution perfectly tailored to the routine analysis of alkali and alkaline earth metals.
The future of flame photometry is not one of obsolescence, but of evolution. Manufacturers continue to innovate, integrating modern technology to enhance its inherent strengths. The development of simultaneous multi-channel detection, built-in air compressors, intelligent safety interlocks, and sophisticated software for automation and data management has made today’s instruments more powerful, user-friendly, and safer than ever before. As long as there is a need for the fast, accurate, and economical measurement of sodium, potassium, lithium, calcium, and barium, the flame photometer, a technique with a rich history and a clear purpose, will continue to be an essential and highly valued instrument in the analytical laboratory.
This guide is maintained by HINOTEK’s core technical team, comprised of senior engineers and application scientists with over two decades of hands-on experience in fields such as microscopy, centrifugation, and spectrophotometry. We are committed to ensuring that every piece of information in this guide—from instrument principles and technical specifications to laboratory procurement advice—maintains the highest level of accuracy and timeliness.
This content is regularly reviewed and updated to reflect the latest industry standards and technological advancements. We value feedback from the global scientific community. Should you have any questions or suggestions, or wish to discuss any technical details, please do not hesitate to contact our expert team at [email protected].