Guide Navigation
- 1. The Fundamental Principle: Separating Molecules with Electricity
- 2. The Anatomy of a Gel Electrophoresis System
- 3. Choosing Your Matrix: Agarose vs. Polyacrylamide Gels (PAGE)
- 4. The Conductor: Selecting the Right Running Buffer (TAE vs. TBE)
- 5. A Practical Walkthrough: Running an Agarose Gel Step-by-Step
- 6. Reading the Results: How to Interpret Your Gel
- 7. Key Applications of Gel Electrophoresis
- 8. Troubleshooting Common Gel Electrophoresis Problems
|
|
Gel electrophoresis (View HINOTEK Gel electrophoresis) is a foundational technique in molecular biology, biochemistry, and genetics. It is a method for separating macromolecules—specifically DNA, RNA, and proteins—based on their size and electrical charge. By applying an electric current to a gel matrix, researchers can sort a complex mixture of molecules into distinct bands, allowing for analysis, identification, and purification. This guide explains the principles behind the technique, the components of the system, the practical steps involved, and how to interpret the results.
1. The Fundamental Principle: Separating Molecules with Electricity
At its core, gel electrophoresis works by moving charged molecules through a filtering medium with an electric field. The final separation is the result of how these two forces—the electric field and the filter—interact with the physical properties of the molecules.
Core Concept: Separation by Size and Charge
The technique separates molecules based on two primary characteristics: their size (molecular weight) and their net electrical charge. An electric current is used to push the molecules through a porous, jelly-like substance called a gel. The pores in this gel act as a sieve, making it more difficult for larger molecules to pass through than smaller ones. As a result, smaller molecules travel farther through the gel in a given amount of time, while larger molecules travel shorter distances.
The Driving Force: The Electric Field
The movement of molecules is driven by an electric field. The gel is placed in a buffer-filled chamber that has a negative electrode (cathode) at one end and a positive electrode (anode) at the other. Samples are loaded into small wells, or indentations, at the negative end of the gel. When the power supply is turned on, the electric field is established. Molecules with a net negative charge are repelled by the negative cathode and attracted to the positive anode, causing them to migrate through the gel toward the positive end.
The Sieve: The Gel Matrix
The gel itself is a matrix of cross-linked polymers that form a microscopic network of pores. This matrix provides a physical barrier, or resistance, to the movement of the molecules. The separation happens because molecules of different sizes navigate this obstacle course at different rates. Smaller molecules find many pores they can pass through easily and thus move quickly. Larger molecules have a much harder time finding pores large enough to squeeze through, which significantly slows their migration. This sieving effect is what allows for the size-based separation.
The process can be understood as a balance between two opposing forces. The electric field provides a constant driving force, pushing the molecules forward. The gel matrix provides a retarding force, or drag, that is proportional to the molecule’s size. A researcher controls the outcome by tuning these two forces. To better separate small fragments that move quickly, one might increase the retarding force by using a denser gel (a higher percentage concentration). This makes the “obstacle course” more difficult and creates more space between the resulting bands. Conversely, to separate very large fragments, one would decrease the retarding force with a less dense gel to allow them to move through the matrix at a reasonable pace.
Why Nucleic Acids Migrate Predictably
For DNA and RNA, the separation process is simplified. The sugar-phosphate backbone of every nucleic acid molecule contains phosphate groups, which give the entire molecule a consistent, uniform negative charge regardless of its specific sequence. This means that for any two DNA fragments, the charge-to-mass ratio is constant. Because the electrical “pull” on each fragment is proportional to its size, and the “drag” from the gel is also proportional to its size, the intrinsic charge does not influence the separation. The only determining factor is size. All fragments of a given size will migrate at the same rate and end up at the same position, forming a distinct “band” on the gel.
The Challenge with Proteins
Proteins are more complex. Unlike the uniform negative charge of nucleic acids, the net charge of a protein depends on its specific amino acid composition and the pH of the surrounding buffer. Furthermore, proteins fold into intricate three-dimensional shapes. Both this variable charge and complex shape would affect how a protein moves through the gel, making it impossible to separate them by size alone. To overcome this, a specific technique called SDS-PAGE is used, which neutralizes these variables. This method is discussed in detail later.
2. The Anatomy of a Gel Electrophoresis System
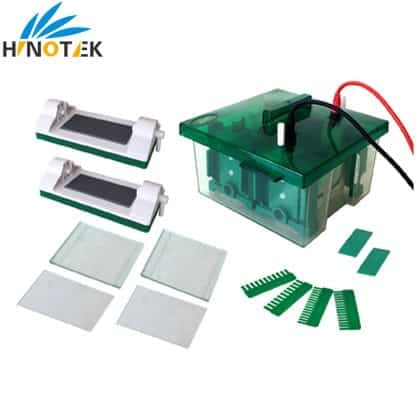
A complete gel electrophoresis system consists of several key pieces of equipment. Each component plays a specific role in creating the right conditions for molecular separation. Understanding these parts is essential for running successful experiments and for selecting the right equipment for your lab’s needs.
The Gel Box (Electrophoresis Chamber)
The gel box, or tank, is the main container that holds the gel and the running buffer. It provides the enclosed environment where the electrophoresis takes place. There are two primary designs:


- Horizontal Systems: In these systems, also known as submarine units, the gel is cast and run in a horizontal orientation. It is completely submerged in the running buffer, which serves to both conduct the electric current and dissipate heat generated during the run. Horizontal systems are the standard for separating DNA and RNA using agarose gels. They are simple to set up and use.
- Vertical Systems: Here, the gel is held vertically between two buffer chambers, an upper and a lower one. This design is used for polyacrylamide gel electrophoresis (PAGE), the standard method for separating proteins.
The physical orientation of the gel is not an arbitrary choice; it is a direct consequence of the gel’s chemistry and the required resolution. Agarose forms a relatively sturdy gel that is easily handled and cast in an open, horizontal tray. Polyacrylamide, however, requires an oxygen-free environment to polymerize properly. It is therefore cast between two glass plates, a setup that naturally lends itself to a vertical orientation. This vertical format allows for much thinner gels, which generate less heat, permit higher voltages, and result in sharper bands and higher resolution. Furthermore, the vertical system’s separate buffer chambers are essential for using discontinuous buffer systems, a key feature of high-resolution protein separation techniques like SDS-PAGE.
The Power Supply

The power supply is the engine of the system. It takes AC power from the wall outlet and converts it into a regulated DC output. It connects to the electrodes in the gel box via electrical leads and creates the electric field that drives the migration of molecules. A reliable power supply is critical for achieving consistent and reproducible results. Most modern power supplies can operate in different modes:
- Constant Voltage: The power supply maintains a fixed voltage throughout the run. As resistance in the gel can change over time, the current may fluctuate. This is the most common mode for standard DNA agarose gels.
- Constant Current: The power supply maintains a steady current, adjusting the voltage as needed to compensate for changes in resistance. This is often preferred for protein PAGE, as it ensures a more stable migration rate.
- Constant Power: The power supply maintains a constant power output (watts), adjusting both voltage and current. This can be useful for long runs to prevent overheating.
The Gel Casting Tray and Combs
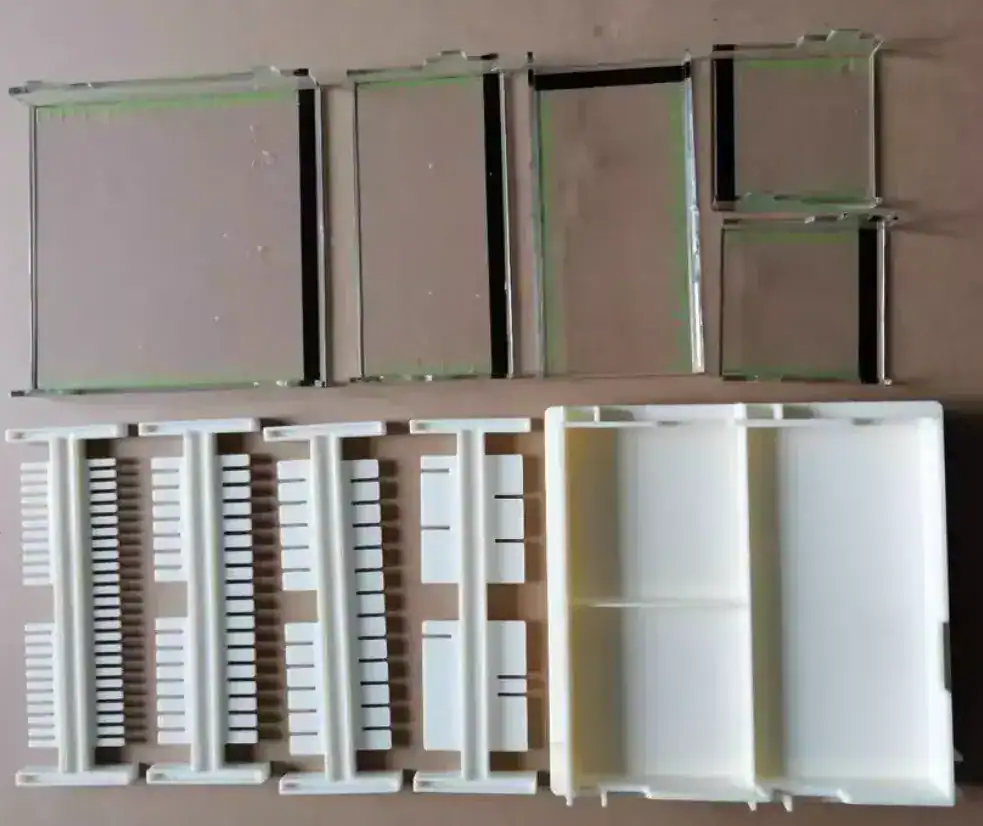 |
Before the run, the gel must be formed into a slab with wells for the samples. This is done using a casting tray and a comb. The tray provides the mold for the gel. The comb is a plastic tool with teeth that is placed into the molten gel. As the gel solidifies, the comb is removed, leaving behind a series of small, pocket-like wells at one end of the gel slab. The size and thickness of the comb’s teeth determine the volume of the wells and can affect the sharpness of the final bands.
The Buffer (Running Buffer)
The running buffer is a salt-containing solution that serves two critical functions. First, it conducts electricity from the power supply through the gel, completing the electrical circuit. Second, it maintains a stable pH during the experiment. This is important because the pH can affect the charge of the molecules being separated (especially proteins) and the stability of the gel matrix. The same buffer used to make the gel is also used to fill the gel box.
The Visualization System (Gel Documentation System)


After the electrophoresis run is complete, the separated bands of molecules are invisible to the naked eye. A visualization system is needed to see the results. This typically involves two components:
- Transilluminator: This is a light box that illuminates the gel. For traditional DNA stains like ethidium bromide, a UV transilluminator is used, which causes the stain bound to the DNA to fluoresce. For newer, safer stains like SYBR Safe, a blue-light transilluminator can be used. Blue light has the added advantage of not damaging the DNA, which is important if the DNA needs to be extracted from the gel for downstream applications like cloning.
- Gel Imager: This is a system for capturing a high-quality image of the fluorescent gel. It usually consists of a dark hood to block out ambient light, a camera, and software for image analysis and documentation.
3. Choosing Your Matrix: Agarose vs. Polyacrylamide Gels (PAGE)
The gel matrix is the heart of the separation process. The choice of material—either agarose or polyacrylamide—depends entirely on the type and size of the molecules being analyzed and the level of resolution required.
|
|
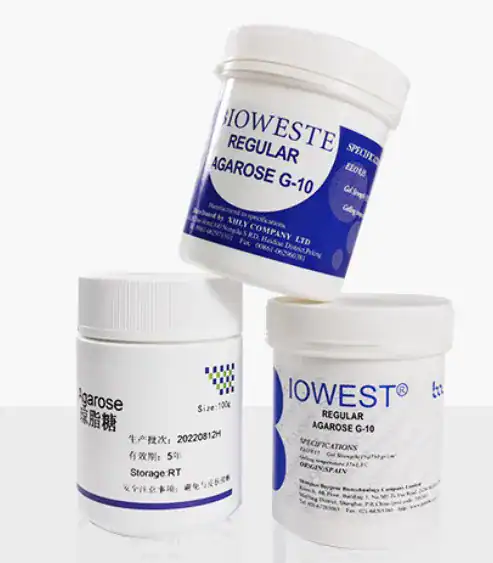
Agarose Gels
- Material: Agarose is a natural polysaccharide polymer extracted from seaweed. It is supplied as a dry powder that is dissolved in buffer by heating. Upon cooling, it forms a porous gel matrix. Agarose is non-toxic and easy to handle.
- Pore Size: Agarose gels have a relatively large and less uniform pore size, typically ranging from 100 to 500 nm. The size of these pores can be controlled by adjusting the concentration of agarose in the gel. A low-percentage gel (e.g., 0.7%) has large pores and is used to separate very large DNA fragments. A high-percentage gel (e.g., 2.0%) has smaller pores and is better for resolving smaller DNA fragments.
- Resolving Power: Agarose gels have lower resolving power than polyacrylamide gels. They are best suited for separating large molecules, such as DNA or RNA fragments ranging from about 200 base pairs (bp) to over 20,000 bp.
- Typical Application: Agarose gel electrophoresis is the standard method for routine analysis of DNA, such as checking the results of a PCR amplification or a restriction enzyme digest.
Polyacrylamide Gels (PAGE)
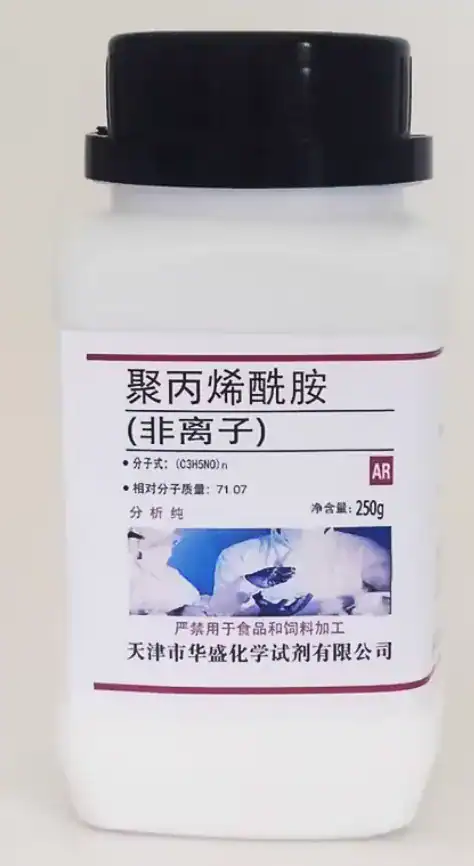 |
- Material: Polyacrylamide is a synthetic polymer formed by cross-linking acrylamide monomers with a cross-linker, typically N,N’-methylenebisacrylamide (bis-acrylamide). Unpolymerized acrylamide is a potent neurotoxin and must be handled with caution, following appropriate safety protocols.
- Pore Size: Polyacrylamide gels have very small, uniform pores, typically in the range of 10 to 200 nm. The pore size can be precisely controlled by adjusting the total concentration of acrylamide and the ratio of acrylamide to bis-acrylamide.
- Resolving Power: These gels offer very high resolution. They can separate molecules that differ in size by less than 1%, and can even resolve DNA fragments that differ by a single base pair.
- Typical Application: PAGE is the method of choice for separating proteins and very small nucleic acid fragments (from 5 to 500 bp).
Special Focus: SDS-PAGE for Protein Separation
To separate proteins based on size, their intrinsic charge and shape must be neutralized. This is accomplished using Sodium Dodecyl Sulfate-Polyacrylamide Gel Electrophoresis (SDS-PAGE). Before loading, protein samples are boiled in a buffer containing the anionic detergent SDS and a reducing agent (like dithiothreitol or β-mercaptoethanol). This treatment has two effects:
- Denaturation: The reducing agent breaks disulfide bonds that hold the protein’s structure together, while SDS disrupts the non-covalent bonds. This unfolds the protein from its complex 3D shape into a linear polypeptide chain.
- Uniform Negative Charge: SDS molecules bind to the polypeptide backbone at a constant ratio (about 1.4 g of SDS per 1 g of protein). This coats the entire protein in a large negative charge that overwhelms its native charge.
After this treatment, all proteins in the sample have a similar linear shape and a uniform negative charge-to-mass ratio. When they are run on a polyacrylamide gel, they migrate solely based on their molecular weight (i.e., the length of their polypeptide chain).
| Feature | Agarose | Polyacrylamide |
| Molecule Type | DNA, RNA (large fragments) | Proteins, small DNA/RNA fragments |
| Resolving Power | Lower (best for fragments >200 bp) | Higher (can resolve single bp differences) |
| Pore Size Range | Large (100–500 nm) | Small (10–200 nm) |
| Gel Orientation | Horizontal | Vertical |
| Material | Natural Polysaccharide | Synthetic Polymer |
| Handling Safety | Non-toxic | Neurotoxin (unpolymerized form) |
4. The Conductor: Selecting the Right Running Buffer (TAE vs. TBE)
For nucleic acid electrophoresis, the choice of running buffer is another critical decision that affects the outcome of the experiment. The two most common buffers are TAE and TBE.
Composition
 |
Both buffers contain Tris, a common buffering agent that maintains a stable pH, and EDTA, a chelating agent that binds divalent cations like magnesium ions. These ions are necessary cofactors for nucleases, enzymes that can degrade DNA. By sequestering them, EDTA helps protect the integrity of the samples. The difference lies in the acidic component:
- TAE (Tris-acetate-EDTA): Uses acetic acid.
- TBE (Tris-borate-EDTA): Uses boric acid.
Performance Comparison
While they may seem similar, TAE and TBE have distinct properties that make them suitable for different applications.
- Buffering Capacity: TBE has a significantly higher buffering capacity than TAE. During electrophoresis, the buffer can become depleted, leading to pH shifts that can affect DNA migration and even melt the gel. TBE resists these changes much better, making it the preferred choice for long runs or when applying high voltages.
- DNA Migration Speed: DNA fragments migrate faster in TAE buffer. This is because TAE has a lower ionic strength and thus better conductivity, allowing for quicker runs at a given voltage.
- Resolution: The choice of buffer affects the resolution of different-sized fragments. TBE provides superior resolution for small DNA fragments (less than 2 kb). The borate ions in TBE interact with the agarose polymers, creating a tighter gel matrix with effectively smaller pores, which enhances the separation of small molecules. In contrast, TAE provides better resolution for large DNA fragments (greater than 2 kb).
- Downstream Applications: This is a critical consideration. Borate, the key component of TBE, is a known inhibitor of many common DNA-modifying enzymes, such as DNA ligase. If the plan is to purify a DNA fragment from the gel for use in a subsequent enzymatic reaction like molecular cloning, TAE buffer must be used. Even trace amounts of borate carried over from a TBE gel can cause the downstream reaction to fail.
| Characteristic | TAE Buffer | TBE Buffer |
| Buffering Capacity | Low (can be exhausted in long runs) | High (stable for long runs/high voltage) |
| DNA Migration Speed | Faster | Slower |
| Best Resolution For | Large DNA fragments (>2 kb) | Small DNA fragments (<2 kb) |
| Enzyme Compatibility | Excellent (no inhibition) | Poor (Borate inhibits enzymes like ligase) |
| Cost | Lower | Higher |
5. A Practical Walkthrough: Running an Agarose Gel Step-by-Step
This protocol outlines the standard procedure for performing DNA separation using agarose gel electrophoresis.
Step 1: Prepare the Agarose Gel
- Measure the required amount of agarose powder and add it to a flask containing the appropriate volume of 1x running buffer (TAE or TBE). The percentage of the gel (e.g., 1%) will determine the resolving power for different-sized DNA fragments.
- Heat the mixture in a microwave or on a hot plate, swirling periodically, until the agarose is completely dissolved and the solution is clear.
- Allow the solution to cool to approximately 50–60°C. It should be hot but comfortable to touch.
- If using an in-gel stain, add the DNA stain (e.g., SYBR Safe) to the molten agarose and swirl to mix.
- Place a comb into the casting tray. Pour the molten agarose into the tray slowly to avoid creating bubbles.
- Let the gel sit at room temperature for 20–30 minutes, or until it has completely solidified.
Step 2: Prepare the DNA Samples
- For each DNA sample, mix the required volume with a loading dye. A common ratio is 1 part loading dye to 5 parts DNA sample.
- The loading dye serves two purposes. It contains glycerol, which increases the density of the sample, allowing it to sink neatly into the well. It also contains one or more colored tracking dyes (such as bromophenol blue or xylene cyanol) that migrate through the gel at a predictable rate, providing a visual indicator of the electrophoresis progress.
Step 3: Assemble the Apparatus and Load the Gel
- Once the gel is solid, carefully and gently remove the comb, leaving a series of wells.
- Place the casting tray with the gel into the gel box.
- Fill the gel box with 1x running buffer until the buffer just covers the surface of the gel.
- Using a micropipette, carefully load your molecular weight marker (DNA ladder) into the first well.
- Using a fresh pipette tip for each sample, carefully load your prepared DNA samples into the subsequent wells. Dispense the sample slowly into the well, being careful not to puncture the bottom of the gel.
Step 4: Run the Electrophoresis
- Place the lid on the gel box, making sure the electrodes are correctly oriented. The wells should be at the negative (black) end, so the DNA will migrate toward the positive (red) end. Remember: “Run to Red.”
- Connect the electrical leads from the gel box to the power supply.
- Turn on the power supply and set the desired voltage (a typical setting is 80–150 V).
- Run the gel until the fastest-moving tracking dye has migrated approximately 75–80% of the length of the gel. A typical run takes about 45–90 minutes.
Step 5: Staining and Visualizing the DNA
- When the run is complete, turn off the power supply and disconnect the leads.
- Carefully remove the lid and lift the gel tray out of the box.
- If you did not add stain to the gel itself (pre-staining), you must now post-stain it by submerging the gel in a container with buffer and the appropriate DNA stain for about 20–30 minutes.
- Place the stained gel onto the surface of a transilluminator.
- Turn on the transilluminator’s light source (UV or blue light). The DNA bands will fluoresce and become visible.
- Use a gel documentation system to capture a digital image of the gel for analysis and record-keeping.
6. Reading the Results: How to Interpret Your Gel
The image of your gel contains a wealth of information. Proper interpretation involves analyzing the position, intensity, and number of bands, using the DNA ladder as a reference.
The DNA Ladder (Molecular Weight Marker)
The most crucial component for analysis is the DNA ladder. This is a mixture of DNA fragments of known, predefined sizes that is loaded into one of the wells. As it runs, it separates into a series of distinct bands, each corresponding to a specific size in base pairs (bp) or kilobases (kb). This ladder acts as a molecular ruler.
To estimate the size of an unknown DNA fragment in your sample, you compare its migration distance to the bands in the ladder lane. If a band in your sample lane is horizontally aligned with the 500 bp band of the ladder, your fragment is approximately 500 bp in size.
Analyzing the Bands
Beyond size, the bands themselves provide more information. A skilled researcher reads a gel not just for size, but for qualitative and semi-quantitative data about the quality and state of the sample. The imperfections often tell the most important part of the story.
- Position: As established, larger fragments move slower and are found closer to the wells (the top of the gel). Smaller fragments move faster and are found closer to the bottom.
- Intensity (Brightness): The brightness of a band is roughly proportional to the amount of DNA in that band. A bright, thick band indicates a high concentration of that fragment. A faint, thin band indicates a much lower concentration. This allows for a semi-quantitative estimation of the DNA yield.
- Number of Bands: A single, sharp band usually indicates a pure sample, such as a successful PCR product. Multiple distinct bands indicate that the sample contains a mixture of DNA fragments of different sizes, which is the expected result from a restriction enzyme digest.
- Smears: A smear, rather than a sharp band, indicates either that the DNA sample has been degraded into many fragments of varying sizes or that the well was overloaded with too much DNA. This is often a sign of a poor-quality sample.
- Unexpected Bands: The appearance of bands that were not expected can indicate issues like contamination in the sample, non-specific amplification during PCR, or an incomplete restriction digest. This makes the gel a powerful diagnostic check on the previous step in a workflow.
Identifying Different DNA Conformations (for Plasmid DNA)
When analyzing uncut plasmid DNA, a single plasmid sample can confusingly appear as multiple bands. This is because the plasmid can exist in different physical shapes, or conformations, that migrate differently:
- Supercoiled: This is the native, compact, tightly wound form of the plasmid inside a cell. Because it is so compact, it moves through the gel matrix the fastest and appears as the lowest band. A good quality plasmid preparation will consist mostly of this form.
- Nicked (or Relaxed) Circular: If one of the two DNA strands is broken (“nicked”), the tension is released, and the plasmid unwinds into a large, floppy circle. This bulky shape is severely slowed by the gel matrix, so it migrates the slowest and appears as the highest band.
- Linear: If both strands are cut at the same place (e.g., by a restriction enzyme), the plasmid becomes a single linear piece of DNA. It migrates at a rate between the supercoiled and nicked forms.
Special Topic: Choosing a DNA Stain – Ethidium Bromide vs. SYBR Safe
The choice of stain affects not only safety but also the quality of your results, especially for downstream applications.
- Ethidium Bromide (EtBr): For decades, EtBr has been the standard. It is inexpensive and highly sensitive. However, it is a potent mutagen and must be handled as hazardous waste. It requires UV light for visualization, and this high-energy light can cause significant damage to the DNA in the gel, such as creating nicks and cross-links. This damage can dramatically reduce the efficiency of subsequent enzymatic reactions, like cloning.
- SYBR Safe: This is one of several newer stains designed as a safer alternative to EtBr. It has been shown to be significantly less mutagenic. A major advantage of SYBR Safe is that it can be visualized with blue light. Blue light does not damage DNA, which means that fragments purified from a gel stained with SYBR Safe and visualized with a blue-light transilluminator have much higher success rates in downstream applications like cloning.
7. Key Applications of Gel Electrophoresis
Gel electrophoresis is not just an analytical technique; it is an indispensable tool in countless molecular biology workflows.
- Verification of PCR Products: After performing a Polymerase Chain Reaction (PCR) to amplify a specific DNA sequence, gel electrophoresis is the standard method to check if the reaction was successful. The presence of a single, sharp band at the expected molecular weight confirms that the target DNA was amplified.
- Analysis of Restriction Enzyme Digests: In molecular cloning, restriction enzymes are used to cut DNA at specific sites. Gel electrophoresis is used to analyze the resulting fragments. The pattern of bands on the gel can be compared to a predicted pattern to confirm that the DNA was cut correctly, verifying the identity of a plasmid or the success of a cloning step.
- Purification of DNA Fragments: The technique can be used preparatively. After separating a mixture of DNA fragments, the band containing the fragment of interest can be physically cut out of the gel with a scalpel. The DNA is then extracted from the agarose slice, resulting in a purified sample of that specific fragment, ready for use in cloning, sequencing, or other applications.
- DNA Fingerprinting: In forensics and paternity testing, gel electrophoresis is used to create a DNA fingerprint. An individual’s DNA is cut with specific restriction enzymes, and the resulting fragments are separated on a gel. Because every individual’s DNA sequence is slightly different, the pattern of fragment sizes will be unique. This technique, known as Restriction Fragment Length Polymorphism (RFLP) analysis, creates a distinct band pattern that can be used to identify individuals.
- Foundation for Blotting Techniques: Gel electrophoresis is the critical first step for several advanced detection methods:
- Southern Blotting: Used to detect a specific DNA sequence in a complex sample. After separation by gel electrophoresis, the DNA fragments are transferred to a solid membrane. This membrane is then exposed to a labeled DNA “probe” that is complementary to the target sequence, allowing for its specific detection.
- Northern Blotting: This is analogous to Southern blotting but is used to detect and analyze specific RNA molecules.
- Western Blotting: Used to detect a specific protein. Proteins are first separated by SDS-PAGE, then transferred to a membrane, and finally probed with an antibody that specifically binds to the target protein.
8. Troubleshooting Common Gel Electrophoresis Problems
Even a routine technique like gel electrophoresis can produce confusing or failed results. Understanding the common visual artifacts and their causes is key to effective troubleshooting.
| Problem | Possible Cause(s) | Recommended Solution(s) |
| “Smiling” Bands (Bands curve upwards at the edges) | Excessive heat causes the center of the gel to run faster than the cooler edges. This is usually caused by setting the voltage too high. | Decrease the voltage and run the gel for a longer period. Use fresh, chilled buffer. If possible, run the gel in a cold room or on an ice pack. |
| Smeared Bands (No sharp, distinct bands) | 1. DNA sample is degraded. 2. Too much DNA was loaded in the well. 3. High salt concentration in the sample is interfering with migration. | 1. Use fresh samples and ensure buffers contain EDTA to inhibit nucleases. 2. Quantify DNA before loading and reduce the amount. 3. Dilute the sample or use a DNA purification kit to remove excess salt. |
| No Bands Visible | 1. DNA ran off the end of the gel. 2. Electrodes were connected backwards (DNA ran up and out of the gel). 3. Insufficient amount of DNA was loaded. 4. Problem with the DNA stain (e.g., old, degraded, or forgotten). | 1. Monitor the tracking dye more closely and stop the run earlier. 2. Ensure the wells are at the negative (black) electrode. 3. Load more DNA. 4. Prepare fresh stain or ensure it was added correctly. |
| Distorted or Wavy Bands | 1. Wells were damaged during comb removal. 2. Debris or air bubbles in the well. 3. Sample was overloaded, causing it to spill into adjacent lanes. 4. High salt in the sample. | 1. Remove the comb slowly and gently. Rinse wells with buffer before loading to check for damage. 2. Ensure wells are clear before loading. 3. Load a smaller volume or lower concentration of DNA. 4. Dilute the sample. |
| Gel Running Too Slowly or Too Quickly | 1. Incorrect buffer concentration (too concentrated runs slow; too dilute runs fast). 2. Incorrect voltage setting on the power supply. | 1. Prepare fresh 1x running buffer from a stock solution of the correct concentration. 2. Double-check the voltage setting on the power supply. |
If you are ready to find the right Electrophoresis for your laboratory, please browse our complete product range: Electrophoresis Cell
This guide is maintained by HINOTEK’s core technical team, comprised of senior engineers and application scientists with over two decades of hands-on experience in fields such as microscopy, centrifugation, and spectrophotometry. We are committed to ensuring that every piece of information in this guide—from instrument principles and technical specifications to laboratory procurement advice—maintains the highest level of accuracy and timeliness.
This content is regularly reviewed and updated to reflect the latest industry standards and technological advancements. We value feedback from the global scientific community. Should you have any questions or suggestions, or wish to discuss any technical details, please do not hesitate to contact our expert team at [email protected].