|
|
|

This article provides a comprehensive and in-depth comparative analysis of Fluorescence Spectrophotometer vs UV-Visible Spectrophotometer, intended to support decision-making for laboratory managers, senior researchers, and instrumentation market professionals. The article clearly establishes that while both techniques fall under the umbrella of spectrophotometry, they are based on fundamentally different physical principles—absorption versus emission—which leads to significant disparities in their performance, applications, and market positioning.
The core distinction between the two technologies is this: the UV-Vis spectrophotometer is a versatile, cost-effective “workhorse” suitable for routine quantitative analysis of relatively high-concentration, pure samples. In contrast, the fluorescence spectrophotometer is a highly sensitive, exceptionally specific “specialist,” excelling in trace analysis, the study of complex mixtures, and the exploration of intermolecular interactions.
The fundamental reason for the vast difference in sensitivity lies in their measurement modalities: UV-Vis spectrophotometry measures the small difference between two large signals (incident and transmitted light), whereas fluorescence measures a weak emission signal directly against a near-zero background. This principled difference gives fluorescence a far superior signal-to-noise ratio and a much lower limit of detection.
By dissecting the classic “Thermo Fisher NanoDrop (UV-Vis) vs. Thermo Fisher Qubit (Fluorescence)” case study in the life sciences, this article concretely demonstrates the critical impact of these technical differences in real-world applications. This example clearly illustrates the trade-off between convenience and accuracy when facing different analytical needs.
Ultimately, the primary conclusion of this article is that the choice between these two technologies is not about determining which is “better,” but rather about selecting the “most appropriate tool” based on the specific scientific question, sample characteristics, and analytical objectives. UV-Vis spectrophotometry answers the question, “How much light was absorbed?” while fluorescence spectrophotometry answers, “Is a specific luminescent molecule present?” Understanding this fundamental difference is the key to making an informed instrument selection.
Part I: User Perspective: A Deep Dive into Technology and Applications
Section 1: Fundamental Principles: Absorption vs. Emission
This section aims to elucidate the foundational physics of both technologies, which fundamentally dictate their respective capabilities and limitations.
1.1 UV-Visible Spectrophotometer: The Practice of Light Absorption Law
The core principle of UV-Vis spectrophotometry is the measurement of the attenuation of light as it passes through a sample. The instrument performs analysis by quantifying the amount of light absorbed by a sample at specific wavelengths in the ultraviolet (UV) and visible (Vis) regions of the spectrum.
The quantitative basis for this technique is the Beer-Lambert Law. This law reveals a direct linear relationship between a substance’s absorbance (A) and its molar absorptivity (ϵ \epsilon ),thepathlengthofthelight( b ),andthesample′sconcentration( c ) under specific conditions. Its mathematical expression is: A=ϵbc, it is this proportionality between absorbance and concentration that makes precise quantitative analysis possible.
1.2 Fluorescence Spectrophotometer: The Utilization of Light Emission
Unlike absorption, fluorescence is a more complex, multi-step photophysical process. It involves a molecule absorbing light of one wavelength (excitation) and then, almost instantaneously, emitting light of a longer, lower-energy wavelength (emission).
|
|
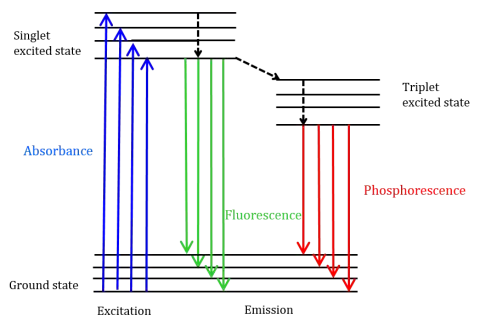
This process is clearly described by a Jablonski Diagram. First, a molecule absorbs a photon, promoting an electron from the ground state to a higher singlet excited state . Subsequently, the excited electron rapidly loses some energy through non-radiative transitions (like vibrational relaxation), descending to the lowest vibrational level of the state. Finally, the electron returns to the ground state via a radiative transition, emitting a photon in the process—this is fluorescence. Because energy is lost during vibrational relaxation, the emitted fluorescent photon always has less energy than the absorbed excitation photon, and therefore a longer wavelength. This difference between the excitation and emission wavelengths is known as the Stokes Shift.
A key parameter influencing the intensity of the fluorescence signal is the fluorescence quantum yield, which is the ratio of photons emitted to photons absorbed. The quantum yield is an intrinsic property of the fluorescent molecule (fluorophore) and directly determines its emission efficiency.
1.3 The Core Difference Fluorescence Spectrophotometer vs UV-Visible Spectrophotometer: Why Measuring a Signal in the Dark is Crucial
The vast difference in sensitivity between the two techniques is rooted in the fundamental difference in their signal measurement methods.
The measurement in UV-Vis spectrophotometry is essentially the calculation of a small difference between two large signals. In a low-concentration sample, the transmitted light intensity ( Iₜ(I-sub-t)) is very close to the incident light intensity I₀(I-naught), making their difference extremely small. Any minor measurement error, such as fluctuations in the light source or detector noise, is amplified in the calculated difference, severely impacting the signal-to-noise ratio (S/N). This is analogous to trying to determine the weight of a single feather by weighing a fully loaded truck, and then weighing the same truck with the feather on it—it is nearly impossible.
In contrast, the measurement in fluorescence spectrophotometry is the direct measurement of a weak signal against a very dark (ideally, completely black) background. Due to its unique detector geometry (detailed in the next section), the detector can effectively avoid the high-intensity excitation light and only receive the fluorescence emitted by the sample. This measurement method drastically reduces background noise, leading to a significant improvement in the S/N ratio. This is like being in a completely dark room, where the faint light from a single firefly is clearly visible.
This fundamental difference in measurement principle is the direct cause of fluorescence being typically three orders of magnitude (1000 times) or more sensitive than UV-Vis absorption. The subtractive measurement mode of UV-Vis results in a sharp decline in S/N at low concentrations, whereas the direct measurement mode of fluorescence maintains a high S/N even at extremely low concentrations, which directly translates to its lower detection limit.
Section 2: Instrument Design and Optical Configuration
This section will delve into a comparison of the physical components and optical layouts of the two instruments, linking hardware choices to the fundamental principles described in Section .
2.1 A Tale of Two Geometries: In-Line vs. 90-Degree Detection Paths
The geometric configuration of an instrument is a direct manifestation of its working principle and a key factor in its performance differences.
|
|

UV-Visible Spectrophotometer: Its core components—light source, sample holder, and detector—are arranged in a straight line (i.e., a 180-degree or in-line configuration). This layout is a prerequisite for measuring the transmitted light ( Iₜ(I-sub-t)) relativetotheincidentlight I₀(I-naught). Designs can be single-beam, double-beam, or diode-array. A double-beam design splits the light into two paths, one through the sample and the other through a reference (usually the solvent), allowing for real-time correction of light source fluctuations and improving measurement accuracy. A diode-array design illuminates the sample with polychromatic light, and a grating disperses the transmitted light onto a detector array, enabling instantaneous acquisition of the entire spectrum.
Fluorescence Spectrophotometer: Its most distinctive structural feature is that the detector is placed at a 90-degree right angle to the excitation light path. This orthogonal geometry is a critical design choice aimed at minimizing interference from the excitation light. Since fluorescence is emitted in all directions while the excitation light travels primarily in a straight line, the 90-degree angle allows the detector to effectively avoid the high-intensity transmitted and scattered light, ensuring it primarily measures the weak fluorescent emission signal. This design is the physical basis for implementing the high-sensitivity strategy of “measuring a signal against a dark background”.
2.2 Comparative Analysis of Key Components
Light Source
- UV-Visible Spectrophotometer: Traditionally uses a Deuterium lamp (D₂) for the UV region (approx. 160-400 nm) and a Tungsten-Halogen lamp for the visible region (approx. 350-800 nm). Some portable or long-life models, increasingly use a Xenon flash lamp, which covers the entire UV-Vis spectrum, has a very long lifespan, and requires no warm-up time.
- Fluorescence Spectrophotometer: Requires a higher intensity light source to excite the sample and produce the strongest possible fluorescence. Historically, low-pressure Mercury vapor lamps were used. Currently, the most common source is a high-pressure Xenon arc lamp, which provides a continuous and high-intensity spectrum in the UV and visible regions. In recent years, Lasers and Light-Emitting Diodes (LEDs) have also become more prevalent in specific applications (like Laser-Induced Fluorescence, LIF) due to their excellent monochromaticity, high intensity, and stability. HINOTEK fluorescence spectrophotometer use Hamamatsu Xenon Arc Lamps (Life is 2000 Hours)
Wavelength Selector (Monochromator/Filter)
- UV-Visible Spectrophotometer: Typically includes one monochromator (most commonly a diffraction grating) to separate the desired wavelength of monochromatic light from the polychromatic source before it passes through the sample. The quality of the grating (e.g., holographic is superior to ruled) and the width of the slit together determine the instrument’s optical resolution.
- Fluorescence Spectrophotometer: Its defining feature is the presence of two independent wavelength selection systems. The first is the
excitation-side monochromator, which selects a specific wavelength from the source light to excite the sample. The second is the emission-side monochromator (or emission filter), which selects only the specific wavelength of fluorescence from all the light emitted by the sample to reach the detector. This dual-monochromator (or monochromator/filter combination) configuration is the instrumental basis for the high specificity of fluorescence technology.
Detector
- UV-Visible Spectrophotometer: Photodiode arrays (PDA) are common in array-based instruments, while Photomultiplier tubes (PMTs) are often used in scanning instruments.
- Fluorescence Spectrophotometer: Because the fluorescence signal is often very weak, it almost exclusively uses highly sensitive Photomultiplier tubes (PMTs) as detectors to ensure effective detection of low-level photons.
The hardware configuration of an instrument not only determines its performance but also reveals its design philosophy. The presence of two monochromators in a fluorescence spectrophotometer is key to its ultra-high specificity. A UV-Vis spectrum is a two-dimensional plot (absorbance vs. wavelength). A fluorescence spectrum, however, has two wavelength variables: the excitation wavelength ($ \lambda_{ex}
)andtheemissionwavelength( \lambda_{em} $). This allows fluorescence analysis to generate various types of plots: scanning the emission spectrum at a fixed excitation wavelength, scanning the excitation spectrum at a fixed emission wavelength, or scanning both simultaneously to generate a three-dimensional Excitation-Emission Matrix (EEM). This 3D plot is like a molecule’s “optical fingerprint,” offering extremely high specificity. In reality, two compounds might have very similar absorption spectra (i.e., excitation spectra), but their emission spectra could be completely different. Therefore, by selectively combining excitation and emission wavelengths, fluorescence can effectively distinguish components that are completely overlapping and indistinguishable in a UV-Vis spectrum, providing an unparalleled advantage in analyzing complex mixtures.
Section 3: Performance Benchmarks: Sensitivity, Specificity, and Dynamic Range
This section will quantify the performance differences between the two technologies and use a well-known real-world case study to make the impact of these differences tangible and profound.
3.1 The Sensitivity Gap: A Deep Dive into S/N Ratio and Detection Limits
Quantitative Comparison: Literature and technical data consistently show that fluorescence is typically 10 to 1,000 times more sensitive than UV-Vis absorption. In some cases, this gap can be as astonishing as 500,000-fold.
Limit of Detection (LOD): This superior sensitivity directly translates to extremely low detection limits. Fluorescence can quantify analytes at concentrations as low as parts-per-trillion (ppt) or $ 10^{-6} $ M levels.18 In life science applications, its lower limit for DNA quantification can reach 10 pg/μL. In contrast, the lower limit for reliable quantification by UV-Vis is typically in the range of several ng/μL.
Reason Revisited: The huge advantage in sensitivity ultimately comes down to the difference in measurement principles—the fundamental distinction between directly measuring an emission signal against a dark background (high S/N) and measuring the small difference between two large signals (low S/N).
3.2 The Specificity Advantage: Resolving a Target in a Complex Mixture
Limitations of UV-Vis: UV-Vis absorption is inherently non-specific. It cannot distinguish between the target analyte and any other substance in the sample that absorbs at the same wavelength. When analyzing complex biological samples, environmental samples, or food matrices, this spectral interference from co-existing substances is a major source of error.
High Specificity of Fluorescence: The high specificity of fluorescence comes from two levels:
- Intrinsic Molecular Property: Not all molecules fluoresce. Only those with specific structures (usually conjugated aromatic ring systems), known as fluorophores, can produce significant fluorescence emission after excitation. This property itself filters out a large number of non-luminescent background molecules.
- Instrumental Selectivity: As mentioned earlier, the dual monochromator system allows the user to select both an optimal excitation wavelength and a unique emission wavelength. This makes it possible to distinguish between compounds with similar absorption spectra but different emission spectra, thereby greatly increasing analytical selectivity.
Furthermore, specificity can be enhanced by using fluorescent probes or labels (such as Green Fluorescent Protein (GFP) or various fluorescent dyes). These probes can specifically bind to a non-fluorescent target molecule, making it “visible” and enabling its detection.
3.3 Case Study: NanoDrop (UV-Vis) vs. Qubit (Fluorescence) for Nucleic Acid Quantification
This case is a microcosm of the real-world debate between UV-Vis and fluorescence, widely discussed in research forums and literature, and perfectly illustrates the practical impact of their differences in sensitivity and specificity.
NanoDrop (UV-Vis Representative): This instrument quantifies nucleic acids by measuring the sample’s absorbance at 260 nm. Its advantages are speed, minimal sample volume requirement (1-2 μL), and no need for reagents. However, its fatal flaw is its non-specificity: it measures the sum of everything that absorbs at 260 nm, which includes double-stranded DNA (dsDNA), single-stranded DNA (ssDNA), RNA, free nucleotides, and even some phenol contaminants. This often leads to a significant overestimation of the target (e.g., dsDNA) concentration. Nevertheless, the NanoDrop remains a valuable tool for assessing sample purity via the A260/A280 and A260/A230 ratios.
Qubit (Fluorescence Representative): This system uses a series of proprietary fluorescent dyes that specifically bind to a particular type of molecule (e.g., one dye binds only to dsDNA, another only to RNA). The instrument then measures the fluorescence intensity emitted by the dye after it binds to the target molecule. This method is extremely specific and completely ignores contaminants that would be detected by the NanoDrop (like RNA, free nucleotides, etc.).
The Difference in Results: Users frequently report that for the same sample, the concentration measured by NanoDrop is significantly higher than the Qubit reading, with differences ranging from 40% to over 5-fold. This discrepancy is not because one instrument is “inaccurate,” but because they are measuring different things: NanoDrop measures “total absorbance,” while Qubit measures “specific target concentration.”
Relevance to Applications: In downstream applications where the starting concentration is critical, such as Next-Generation Sequencing (NGS), an accurate initial amount of dsDNA is key to success. In this context, the fluorescence-based Qubit is recognized as the “gold standard.” Using an overestimated concentration from a NanoDrop for NGS library preparation is likely to result in insufficient library yield, poor data quality, or even the failure of the entire sequencing run, causing a huge waste of time and money. Therefore, a typical molecular biology lab workflow is to first use a NanoDrop for a quick purity check, and then use a Qubit for final, precise quantification.
This well-known case is more than just a comparison of two brands; it is a tangible, perceivable embodiment of the entire UV-Vis vs. fluorescence technology debate. It perfectly encapsulates the trade-off between convenience/speed (NanoDrop) and accuracy/specificity (Qubit). A life scientist needing to quantify DNA faces a choice between two common instruments. The NanoDrop is fast, convenient, and provides purity information, seeming like the obvious choice. The Qubit requires kits, sample prep, and standards, making it time-consuming and adding a per-sample cost. However, when the experiment (like NGS) demands a precise input of dsDNA, the scientist discovers that the NanoDrop reading is inflated by RNA and free nucleotides, and only the Qubit provides the specific dsDNA concentration. At this point, the user is forced to understand that the “convenience” of the NanoDrop comes at the cost of accuracy, which is unacceptable in critical applications. The “cost” of the Qubit is an investment in data quality and experimental success. This real-world scenario compels the user to understand the fundamental principles of absorption and fluorescence to make the correct methodological choice.
Section 4: Application Areas and Use Cases
This section matches the unique advantages of each technology with specific analytical tasks, providing users with a clear application guide.
4.1 UV-Visible Spectrophotometry: The Indispensable “Workhorse” for Routine Analysis
With its ease of use, speed, low cost, and versatility, UV-Vis spectrophotometry plays a fundamental and critical role in numerous fields.
- Quantitative Analysis of Pure Substances: Measuring the concentration of known pure compounds in simple matrices is its most classic and widespread application.
- Industrial Quality Control (QC): Used in the chemical, materials, and food industries for rapid, routine quality inspection of raw materials and final products with known compositions.
- Purity Assessment: In life sciences, the A260/A280 and A260/A230 ratios are used to assess the purity of nucleic acid and protein samples, identifying potential protein or chemical contamination, an essential pre-experimental step.
- Chemical and Pharmaceutical Analysis: Widely used for drug identification, content determination, dissolution testing, and formulation studies, it is a standard analytical method prescribed in pharmacopoeias.
- Colorimetric Analysis: Used in the food and beverage industry to measure product color or to quantify certain components through color-forming reactions.
- Educational Experiments: Its robust performance, intuitive operation, and direct connection to the fundamental Beer-Lambert Law make it a standard fixture in university chemistry and biology teaching labs.
4.2 Fluorescence Spectrophotometry: The “Specialist” for High-Sensitivity and High-Specificity Detection
Fluorescence, with its unparalleled sensitivity and specificity, shines in more challenging analytical tasks.
- Trace Quantitative Analysis: Detecting low concentrations of pollutants (like polycyclic aromatic hydrocarbons, pesticides) in water or soil for environmental monitoring, analyzing trace biomarkers in clinical chemistry, and detecting residual veterinary drugs or toxins in food safety.
- Cutting-Edge Life Science Research:
- Precise Quantification: Accurately measuring low-concentration or precious nucleic acid and protein samples (i.e., the Qubit use case).
- Molecular Interaction Studies: Using techniques like Fluorescence Resonance Energy Transfer (FRET) to study dynamic processes such as protein-protein interactions, DNA hybridization, and enzyme-substrate binding by observing changes in the fluorescence signal.
- Cell Biology: It is the core of techniques like fluorescence microscopy and flow cytometry (FACS), and can be used to track the localization and dynamics of molecules within living cells using probes like Green Fluorescent Protein (GFP).
- Drug Discovery: In High-Throughput Screening (HTS) for new drug development, its high sensitivity and specificity make it an ideal tool for rapidly screening the activity of large numbers of compounds.
- Materials Science: Used to characterize novel fluorescent materials, quantum dots, and dissolved organic matter (DOM) in water bodies.
Table 1: Application Suitability Matrix
To provide users with an intuitive decision-making tool, the following table consolidates the above application information into a comparative matrix.
| Analytical Task | Recommended Primary Instrument | Rationale | Key Considerations / Alternatives |
| Check DNA sample purity | UV-Vis Spectrophotometer | Fast, no reagents needed, directly provides A260/A280 and A260/A230 purity ratios. | Concentration reading may be inflated by contaminants; for purity assessment only. |
| Quantify DNA for critical experiments (e.g., NGS) | Fluorescence Spectrophotometer | Highest level of accuracy and specificity for the target molecule (e.g., dsDNA), ignores contaminant interference. | Requires specific reagent kits, has a per-sample cost, cannot provide purity ratio information. |
| Determine concentration of a synthesized pure drug | UV-Vis Spectrophotometer | Sample is pure, concentration is relatively high; a direct, simple application of the Beer-Lambert Law. | Ensure sample is not turbid and concentration is within the linear range. |
| Screen for trace pesticides in river water | Fluorescence Spectrophotometer | Highest sensitivity for trace analytes, capable of meeting regulatory detection limits. | Potential for matrix quenching effects; may require sample pre-treatment or standard addition for correction. |
| Study the binding of two proteins | Fluorescence Spectrophotometer | Can monitor intermolecular interactions in real-time using techniques like FRET via changes in fluorescence signal. | Requires fluorescent labeling of proteins; experimental design is relatively complex. |
| Routine color QC on an industrial production line | UV-Vis Spectrophotometer | Fast, stable, and reproducible, suitable for routine comparison against known standards. | Only for liquid or transparent solid samples; requires an integrating sphere accessory for opaque samples. |
Section 5: Limitations, Interferences, and Mitigation Strategies
This section will explore the “shortcomings” of each technology, providing users with a balanced perspective on their real-world challenges.
5.1 Navigating the Challenges of UV-Vis Spectrophotometry
- Spectral Overlap: This is the primary limitation of the UV-Vis method. When multiple components in a mixture absorb at similar wavelengths, their absorption spectra overlap, making accurate quantification of any single component extremely difficult, if not impossible.
- Mitigation Strategy: For spectral overlap, chemometric methods such as derivative spectroscopy or multivariate calibration can be used to mathematically resolve the overlapping peaks. However, this requires more complex software and expertise. The most fundamental solution is physical separation via techniques like chromatography before analysis.
- Sample Turbidity and Light Scattering: Suspended particles in a sample cause light to scatter rather than be absorbed. The detector cannot distinguish between scattering and absorption and will misinterpret the light loss from scattering as absorbance, leading to artificially high readings and significant errors.
- Mitigation Strategy: The simplest solution is to filter or centrifuge the sample before measurement. Some high-end instruments are equipped with an integrating sphere accessory that can collect all forward-scattered light, thus reducing the effect of scattering, though this often comes at the cost of some sensitivity.
- Deviations from the Beer-Lambert Law: At high concentrations, intermolecular interactions (like aggregation) can alter the molar absorptivity, causing the linear relationship between absorbance and concentration to fail, a phenomenon known as “negative deviation”. Additionally, instrumental stray light can also cause deviations from linearity in high-absorbance regions.
- Mitigation Strategy: The most common method is to dilute the sample to within the linear response range. Some modern microvolume spectrophotometers use extremely short path lengths to achieve “virtual dilution,” allowing the measurement of high-concentration samples without physical dilution.
5.2 Understanding the Nuances of Fluorescence Analysis
- Fluorescence Quenching: This refers to any process that decreases the fluorescence intensity and is the most significant source of interference in fluorescence analysis. The mechanisms of quenching are diverse, including collisions with quenching molecules (like dissolved oxygen, iodide ions) (dynamic quenching), formation of non-fluorescent ground-state complexes with a quencher (static quenching), or energy transfer to other molecules via FRET.
- Inner-Filter Effect (IFE): This is an artifact closely related to sample concentration.
- Primary Inner-Filter Effect: At high concentrations, molecules at the front of the sample absorb a significant amount of the excitation light, reducing the intensity of the excitation light that reaches the center of the cuvette (the detection region), causing the measured fluorescence intensity to be lower than the actual value.
- Secondary Inner-Filter Effect: At high concentrations, the fluorescence emitted from the center of the sample is re-absorbed by molecules at the outer layers of the cuvette before it reaches the detector. Both types of inner-filter effects cause the linear relationship between fluorescence intensity and concentration to bend at high concentrations, leading to inaccurate quantification.
- Photobleaching: Under continuous exposure to high-intensity excitation light, fluorescent molecules can undergo irreversible photochemical degradation, losing their ability to fluoresce and causing the signal to decay over time.
- Environmental Sensitivity: Fluorescence intensity is extremely sensitive to environmental factors. Changes in temperature, pH, solvent polarity, and viscosity can all cause significant changes in fluorescence intensity.
- Mitigation Strategies: To obtain accurate fluorescence measurements, meticulous experimental control is necessary. For example, de-gassing the sample to remove dissolved oxygen to reduce quenching; using dilute solutions to avoid the inner-filter effect; choosing photostable fluorescent dyes and minimizing exposure time to reduce photobleaching; and strictly controlling the temperature and pH of the sample.
The limitations of these two technologies are direct extensions of their fundamental principles. UV-Vis relies on a relatively simple physical law (Beer-Lambert), so any physical or chemical factor that deviates from the ideal conditions of this law will interfere with it. This means the main challenges for UV-Vis come from external influences of the sample matrix, such as spectral overlap from impurities or scattering from particulates. Fluorescence, on the other hand, relies on a complex photophysical process (the excitation-emission cycle described by the Jablonski diagram), so any process that can compete with fluorescence emission and deactivate the excited state (like quenching, energy transfer, etc.) will be a source of interference. This means the main challenges for fluorescence are more related to the photophysical properties of the analyte itself and its microenvironment. This also explains why fluorescence measurements typically require stricter control over the sample matrix (e.g., pH, temperature, dissolved gases) than UV-Vis measurements.
Part II: Synthesis and Strategic Recommendations
This section combines technical analysis with market insights to provide users with practical, strategic recommendations.
Section 6: An Integrated Instrument Selection Framework
6.1 A Practical Decision Tree
To help users quickly identify the appropriate technology based on their primary needs, the following decision tree provides a clear path:
- What is your analytical objective?
- A. Quantitative Analysis -> Go to Step 2
- B. Purity Assessment (e.g., A260/280) -> Choice: UV-Vis Spectrophotometer. This is its core strength, fast and reagent-free.
- C. Study of Intermolecular Interactions (e.g., FRET) -> Choice: Fluorescence Spectrophotometer. This is the only technology capable of such studies.
- What are your sample characteristics?
- A. High concentration (e.g., >10 ng/μL) and relatively pure components -> Choice: UV-Vis Spectrophotometer. This is its most cost-effective use case.
- B. Extremely low concentration (trace, <10 ng/μL) or sample is very precious -> Go to Step 3
- C. Sample is a complex mixture with potential for spectral interference -> Go to Step 3
- Is specificity critical?
- A. Yes, I must ensure I am measuring the specific target molecule, not contaminants or analogs -> Choice: Fluorescence Spectrophotometer. Its high specificity is key to ensuring data accuracy.
- B. No, I just need a rough estimate of the total amount -> Consider a UV-Vis Spectrophotometer, but be aware that the reading may include non-target substances.
Table 2: Total Cost of Ownership and Operational Comparison
Beyond the initial purchase price, budget and operational costs are key factors that lab managers must consider. The following table provides a comprehensive comparison that goes beyond the initial capital expenditure.
| Comparison Dimension | UV-Vis Spectrophotometer | Fluorescence Spectrophotometer |
| Initial Investment (CAPEX) | Generally lower | Generally higher |
| Per-Sample Cost (OPEX) | Near zero (if no kits are used) | Varies, requires fluorescent dyes/kits |
| Maintenance Needs | Traditional models require lamp replacement; Xenon lamps have long life. Overall maintenance is low. | Overall maintenance is low, but high-intensity Xenon lamps also require periodic replacement. |
| Operator Skill Requirement | Basic level is sufficient for routine operation | Requires more advanced skills to understand and control interferences like quenching and inner-filter effects. |
| Sample Throughput | Fast measurement speed, high throughput | Single measurement is also fast, but sample preparation can be time-consuming; throughput can be increased with automation. |
| Software/Validation Costs | In regulated environments, software compliant with 21 CFR Part 11 may incur extra costs. | Similarly, compliant software is an additional cost in regulated environments. |
6.2 The “And” not “Or” Synergy: When to Use Both
One of the core conclusions of this article, especially in demanding life science fields, is that the best strategy is often not to make an either/or choice between the two, but to leverage their synergistic strengths.
An ideal laboratory workflow involves first using a UV-Vis spectrophotometer (like a 752N) for a quick initial assessment of the sample, obtaining its approximate concentration and key purity ratios (A260/A280, etc.). Then, for samples destined for critical downstream applications (like NGS, qPCR, transfection), a fluorescence spectrophotometer (like a Qubit) is used for accurate, specific quantification. This process fully utilizes the speed and purity assessment capabilities of UV-Vis and the unparalleled accurate quantification ability of fluorescence, thereby ensuring the success of subsequent experiments with maximum efficiency and reliability.
Section 7: Future Outlook and Conclusion
7.1 Emerging Trends
- Hardware Development: Light source technology continues to evolve towards longer life and higher stability, with LEDs and laser sources becoming more widespread. Miniaturization and portability of instruments are also clear trends, liberating analytical capabilities from the central lab.
- Software Innovation: The importance of software is increasingly prominent. Future software will focus more on user-friendliness, automated workflows, and seamless support for regulations (like GLP/21 CFR Part 11).
- Chemometrics: The role of advanced mathematical models in data analysis is growing. Particularly for UV-Vis spectroscopy, chemometric methods can effectively resolve complex spectra, overcoming its inherent limitation of spectral overlap and enabling it to handle problems previously solvable only by separation techniques like chromatography. This trend is, to some extent, blurring the application boundaries between the two technologies.
7.2 Final Synthesis: Choosing the Right Tool for the Right Scientific Question
In summary, the choice between a fluorescence spectrophotometer and a UV-Vis spectrophotometer is not about absolute technical superiority, but about the suitability for the analytical task at hand.
The UV-Vis spectrophotometer, by measuring “How much light was absorbed?”, serves as a powerful, reliable tool for quantifying the total absorbance of a substance. It is simple, direct, and versatile—a cornerstone of scientific research and industrial production.
The fluorescence spectrophotometer, by asking “Is a specific luminescent molecule present?”, acts as an extremely sensitive and specific tool for detection, characterization, and quantification in complex backgrounds. It is sophisticated and complex—a powerful instrument for tackling cutting-edge problems in trace analysis and molecular interactions.
The value of a professional analytical scientist lies not just in knowing how to operate an instrument, but in deeply understanding the different questions these two technologies pose, and in selecting the tool that provides the most direct and reliable answer for their specific scientific goal.
To understand the fundamental principles common to all types of spectrophotometers, be sure to read our main article: What Is a Spectrophotometer & How Does It Work? The Ultimate Guide.
Contact us by email: [email protected]
This guide is maintained by HINOTEK’s core technical team, comprised of senior engineers and application scientists with over two decades of hands-on experience in fields such as microscopy, centrifugation, and spectrophotometry. We are committed to ensuring that every piece of information in this guide—from instrument principles and technical specifications to laboratory procurement advice—maintains the highest level of accuracy and timeliness.
This content is regularly reviewed and updated to reflect the latest industry standards and technological advancements. We value feedback from the global scientific community. Should you have any questions or suggestions, or wish to discuss any technical details, please do not hesitate to contact our expert team at [email protected].