Guide Navigation
- Introduction: A Clear Look at Measuring Water Clarity
- Section 1: The Science of Turbidity: Understanding What Makes Water Cloudy
- Section 2: The Core Principle: How Light Scattering Reveals Water Quality
- Section 3: Anatomy of a Modern Turbidity Meter
- Section 4: Selecting the Right Instrument: Benchtop, Portable, and Online Meters
- Section 5: Turbidity Measurement in Action: Key Applications Across Industries
- Section 6: Best Practices for Accurate and Repeatable Measurements
- Conclusion: The Indispensable Role of the Turbidity Meter
 |
Introduction: A Clear Look at Measuring Water Clarity
At its core, a turbidity (View HINOEK Complete Turbidity Meter Catalog) meter is a scientific instrument designed to answer a simple question: How clear is this liquid?. It accomplishes this by quantifying turbidity, a fundamental optical property that serves as a primary indicator of water quality. Turbidity is the cloudiness or haziness of a fluid caused by large numbers of individual particles that are generally invisible to the naked eye, such as silt, clay, algae, organic matter, and microorganisms. The instrument does not measure a specific chemical or particle type, but rather provides an “expression of the optical property that causes light to be scattered and absorbed rather than transmitted in straight lines” through the sample.
While this may seem like a purely aesthetic measurement, its implications are profound. Turbidity is a powerful, cost-effective, and rapidly measured surrogate parameter. This means a simple turbidity reading can signal the potential presence of more complex, costly, or difficult-to-measure contaminants. A sudden spike in the turbidity of drinking water, for instance, can indicate a failure in the filtration process, potentially allowing harmful pathogens to pass through the system. These suspended particles can physically shield microorganisms from disinfection chemicals or UV light, posing a significant public health risk.
This function elevates the turbidity meter from a simple measurement device to a critical instrument for proactive risk management. It translates a simple optical phenomenon into actionable intelligence about process integrity, environmental health, and potential threats to public safety. For laboratory personnel, environmental scientists, and plant operators, the data provided by a turbidity meter enables a crucial shift from a reactive operational model (“the water is cloudy”) to a proactive one (“turbidity is rising, let’s investigate the cause before it becomes a critical problem”). This guide provides a comprehensive exploration of the science behind turbidity, the instruments used to measure it, and its vital applications across science and industry.
Section 1: The Science of Turbidity: Understanding What Makes Water Cloudy
1.1. A Deeper Definition: More Than Just Cloudiness
Turbidity is the optical characteristic of a liquid that causes light to be scattered and absorbed by suspended and colloidal particles.3 These particles can be incredibly diverse in their composition, including:
- Inorganic materials: Finely divided clay, silt, and sand from soil erosion.
- Organic matter: Algae, plankton, bacteria, and other microorganisms, as well as decaying organic debris.
- Chemical precipitates: Insoluble compounds formed during chemical reactions, common in industrial processes and water treatment.
It is essential to distinguish turbidity from “true color,” which is caused by dissolved substances that absorb light but do not scatter it. A sample of tea, for example, has high color but low turbidity because the color-causing compounds are fully dissolved. A turbidity meter is specifically designed to measure the effect of undissolved particles, though some instrument designs are better than others at compensating for the presence of color.
1.2. The Critical Distinction: Turbidity vs. Total Suspended Solids (TSS)
In the field of water quality analysis, the terms turbidity and Total Suspended Solids (TSS) are often discussed together, but they represent fundamentally different measurements. Understanding this distinction is crucial for correct data interpretation and application.
- Turbidity is an optical measurement. It quantifies the degree to which light is scattered by particles in a sample and is reported in optical units such as Nephelometric Turbidity Units (NTU) or Formazin Nephelometric Units (FNU).
- Total Suspended Solids (TSS) is a gravimetric measurement. It determines the total dry weight mass of all particles above a certain size (typically larger than 2 microns) that are physically filtered out of a known volume of water. The result is expressed as a concentration, usually in milligrams per liter (mg/L).
While a higher concentration of suspended solids generally leads to higher turbidity, there is no universal, direct conversion between TSS (mg/L) and turbidity (NTU). The relationship between the two is entirely dependent on the physical characteristics of the particles themselves. The principles of optics dictate that light scattering is heavily influenced by particle size, shape, color, and refractive index. A TSS measurement, being a simple measure of mass, is completely insensitive to these optical properties.
For example, consider two water samples, both with a TSS of 10 mg/L. Sample A contains fine, highly reflective clay particles, while Sample B contains larger, darker organic particles. Although their mass concentration (TSS) is identical, Sample A will produce a significantly higher turbidity reading because its smaller, more reflective particles are far more efficient at scattering light. This has a critical practical implication: a turbidity meter cannot be used as a universal TSS analyzer out of the box. To reliably use turbidity as a surrogate for TSS in applications like wastewater monitoring, a site-specific correlation must be established. This involves collecting numerous simultaneous turbidity readings and laboratory TSS measurements over a range of conditions to build a unique calibration curve for that specific water source.
1.3. The Broad Impact: Why We Measure Turbidity
The measurement of turbidity is a cornerstone of quality assessment in numerous fields due to its wide-ranging impacts.
- Environmental Health: In rivers, lakes, and oceans, high turbidity is a significant environmental stressor. The cloudiness reduces light penetration, which inhibits the photosynthesis of submerged aquatic plants. This not only harms the plants but also reduces the production of dissolved oxygen, which is vital for fish and other aquatic life. Furthermore, suspended sediments can physically harm aquatic organisms by clogging fish gills and smothering the gravel beds where fish lay their eggs.
- Public Health & Drinking Water: This is one of the most critical applications for turbidity measurement. While high turbidity is aesthetically displeasing to consumers, its primary health concern is its ability to interfere with water disinfection. The suspended particles that cause turbidity can act as shields, protecting harmful microorganisms like bacteria, viruses, and protozoa (e.g., Giardia, Cryptosporidium) from being effectively neutralized by disinfectants like chlorine or ultraviolet (UV) light. For this reason, regulatory bodies such as the U.S. Environmental Protection Agency (EPA) enforce strict legal limits on the turbidity of drinking water.
- Industrial Processes: In a vast array of industries, turbidity serves as a key quality control parameter. A sudden increase in turbidity can indicate a costly filter breakthrough, signal contamination in a product line, or reveal inefficiencies in a treatment process. From ensuring the clarity of beer and wine to verifying the purity of pharmaceutical solutions, turbidity measurement is essential for maintaining product consistency and safety.
Section 2: The Core Principle: How Light Scattering Reveals Water Quality
Turbidity meters operate on the well-understood principles of optics. By measuring how a directed beam of light interacts with the suspended particles in a liquid, the instrument can generate a quantitative value for turbidity.
2.1. The Physics of Measurement: Light’s Interaction with Particles
When a beam of light passes through a perfectly pure liquid, it travels in a straight line with minimal disruption. However, when the liquid contains suspended particles, the light’s path is altered. The particles cause the light to be scattered in all directions (a 360-degree spherical pattern) and also to be absorbed. This combined effect reduces the amount of light that is transmitted directly through the sample. Different measurement techniques have been developed to quantify these effects.
2.2. Nephelometry: Measuring Light at 90 Degrees
Nephelometry is the most common method for measuring low levels of turbidity and is the basis for most regulatory standards. In a nephelometric design, a light source directs a beam into the sample, and a photodetector is placed at a 90-degree angle to the incident beam. This detector measures the intensity of the light that is scattered by the particles at that specific angle.
This method is exceptionally sensitive for several reasons. By measuring against a dark background (where no light would be present in a pure sample), the detector can register very small amounts of scattered light. This makes it the ideal technique for applications where high clarity is required, such as monitoring the final quality of drinking water.
2.3. Turbidimetry: Measuring Transmitted Light
Turbidimetry, also known as the attenuation method, takes a different approach. Instead of measuring scattered light, it measures the loss of light intensity as the beam passes straight through the sample. The photodetector is placed at a 180-degree angle from the light source, directly in the path of the transmitted beam.
This method is less sensitive at low turbidity levels because it involves measuring a small decrease from a very strong signal. However, it is better suited for samples with very high concentrations of particles. In highly turbid samples, multiple scattering events can occur, where light scattered from one particle is then scattered again by another. This can actually reduce the amount of light reaching a 90-degree detector, leading to an inaccurate, falsely low reading. The attenuation method avoids this issue and provides a more linear response at high concentrations, making it useful for analyzing wastewater or industrial slurries.
2.4. The Ratio Method: A More Robust Approach
To overcome the limitations of single-detector designs, many modern turbidity meters employ the ratio method. These instruments incorporate multiple photodetectors placed at various angles, such as 90 degrees (nephelometric), 180 degrees (transmitted), and often a forward-scatter angle as well.
The instrument’s microprocessor analyzes the signals from each detector and calculates a ratio. This ratiometric approach provides a more stable and accurate measurement across a much wider range of turbidity levels. It can intelligently compensate for variables that interfere with simpler designs, most notably sample color. Dissolved color absorbs light, which would cause a non-ratio nephelometer to report a falsely low turbidity. By also measuring the transmitted light, a ratio instrument can account for this absorption and correct the final reading.
The specific angles chosen for the detectors in a turbidity meter are not arbitrary; they are deliberate engineering decisions made to optimize the instrument’s sensitivity for specific types of particles and applications. While the 90-degree nephelometric angle is the established standard for regulatory compliance, particularly in drinking water, it is most sensitive to the very small colloidal particles (0.1–0.5 µm) typically found in such samples. However, for applications involving larger particles, such as microbial cells or fine sediments (0.5–5 µm), a forward-scatter angle (e.g., 11 degrees) is significantly more sensitive because larger particles tend to scatter more light in the forward direction. Conversely, for extremely high turbidity values, measuring back-scattered light can be more effective. This reveals that there is no single “best” optical design for all purposes. An instrument designed strictly for EPA compliance may not be the most effective tool for monitoring cell density in a bioreactor or measuring sediment loads in a river. This understanding allows professionals to look beyond basic compliance and evaluate an instrument’s optical geometry to better match its capabilities to a specific measurement challenge.
Section 3: Anatomy of a Modern Turbidity Meter
While designs vary, all turbidity meters share a set of core components that work together to perform the optical measurement. Understanding these parts is key to appreciating how the instrument functions and how to use it correctly.
3.1. Core Components and Their Functions
A typical laboratory turbidity meter consists of the following key parts:
-
- Light Source: This component generates a stable, consistent beam of light. The type of light source is a critical design feature, typically either a tungsten filament lamp or a light-emitting diode (LED).
- Optics: A system of lenses and apertures focuses the light from the source into a narrow, collimated beam that passes through the center of the sample.
 |
- Sample Chamber and Cuvette: The cuvette is a small, optically clear vial made of glass or plastic that holds the liquid sample. It is placed inside a light-tight sample chamber within the instrument to prevent outside ambient light from interfering with the measurement. The quality and cleanliness of the cuvette are paramount for accurate readings.
- Photodetector(s): These are sensitive electronic sensors that detect the light scattered or transmitted by the sample. They convert the light intensity into a proportional electrical signal, which is then processed by the instrument’s electronics.
- Light Trap: Positioned opposite the light source, the light trap is a non-reflective, black surface or chamber designed to absorb the main beam of light after it has passed through the sample. This crucial component prevents stray light from reflecting within the instrument and reaching the detector, which would cause falsely elevated readings, especially at low turbidity levels.
3.2. The Great Divide: US EPA 180.1 vs. ISO 7027 Standards
For professionals involved in regulatory reporting or international trade, understanding the two major global standards for turbidimeter design is essential. These standards are not interchangeable, and the choice of instrument often depends on geographical location and application.
US EPA Method 180.1
This is the standard method required for turbidity reporting to the U.S. Environmental Protection Agency, primarily for drinking water compliance. Its key specifications are:
- Light Source: A tungsten filament lamp operating at a color temperature between 2200 and 3000 Kelvin. This produces a broad spectrum of “white” light.
- Detector: A nephelometric detector centered at 90° ± 30° to the incident light path, with a spectral peak response between 400 and 600 nm.
- Primary Limitation: The use of white light makes this method susceptible to interference from colored samples. Dissolved substances that impart color (like tannins in natural water) can absorb some of the light, leading to an underestimation of the true turbidity.
ISO 7027
This is the international standard widely adopted in Europe and many other parts of the world. It was designed specifically to overcome the color interference issue of the EPA method. Its key specifications are:
- Light Source: An infrared (IR) light-emitting diode (LED) with an emission wavelength of 860 nm and a spectral bandwidth of less than or equal to 60 nm.
- Primary Advantage: Most colored compounds found in water do not absorb light in the infrared portion of the spectrum. Therefore, an ISO 7027-compliant meter can accurately measure turbidity even in highly colored samples like wine, beer, or treated wastewater, where an EPA-method meter would produce erroneous results.
3.3. Demystifying Turbidity Units: NTU, FNU, and More
The different units used to report turbidity are directly tied to the instrument design and the standard it follows.
- NTU (Nephelometric Turbidity Unit): This is the unit specified by US EPA Method 180.1. It signifies a nephelometric (90° scatter) measurement made with a white light (tungsten lamp) source.
- FNU (Formazin Nephelometric Unit): This is the unit specified by ISO 7027. It also signifies a nephelometric (90° scatter) measurement but is made with an 860 nm infrared light source. Although both NTU and FNU are calibrated against the same formazin primary standard, the readings from the two methods are not directly comparable due to the different light sources and their interaction with particles.
- FTU (Formazin Turbidity Unit): This is a more generic term. While it indicates that the instrument is calibrated with formazin, it does not specify the type of light source or the detector angle.
- FAU (Formazin Attenuation Unit): This unit specifically denotes a measurement made using the attenuation (transmitted light at 180°) method, typically with an ISO 7027-compliant infrared light source. It is used for measuring highly turbid waters.
- JTU (Jackson Turbidity Unit): A historical unit derived from the Jackson Candle Turbidimeter, an early visual method. While largely obsolete, it established the principle of turbidity measurement and is roughly equivalent to NTU at certain levels.
The following table provides a quick-reference summary of the primary turbidity units and their corresponding standards.
Table 1: Comparison of Turbidity Measurement Standards and Units
| Unit | Governing Standard | Light Source | Measurement Principle | Key Characteristics & Applications |
| NTU | US EPA 180.1 | Tungsten Lamp (White Light) | 90° Nephelometry | Required for US regulatory compliance (e.g., drinking water). Prone to interference from sample color. |
| FNU | ISO 7027 | 860 nm IR LED | 90° Nephelometry | International standard. Excellent for colored samples (e.g., wastewater, beverages). |
| FAU | ISO 7027 | 860 nm IR LED | 180° Attenuation | Used for highly turbid samples where nephelometry is ineffective (e.g., industrial slurries, raw wastewater). |
Section 4: Selecting the Right Instrument: Benchtop, Portable, and Online Meters
Turbidity meters are available in three main configurations, each designed to meet different operational needs, from high-precision laboratory analysis to continuous, automated process control.
|
|
|
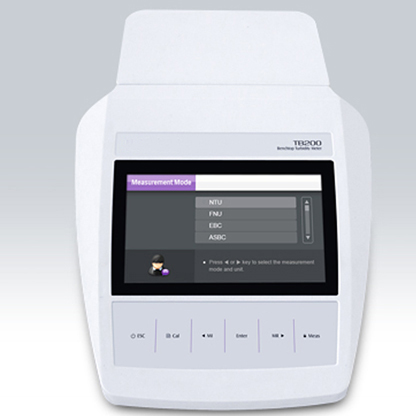
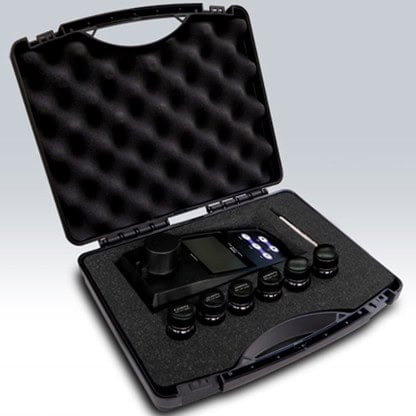
4.1. Benchtop Turbidity Meters: The Laboratory Standard
Benchtop meters are high-precision instruments designed for stationary use in a controlled laboratory environment.1 They represent the gold standard for accuracy and are the instrument of choice for analyzing grab samples for regulatory compliance, research, and final product quality assurance.
- Advantages: They typically offer the highest level of accuracy, precision, and resolution, especially at very low turbidity levels. Advanced models feature multiple measurement modes (e.g., ratio, non-ratio), comprehensive data logging capabilities that comply with Good Laboratory Practice (GLP) standards, and connectivity options for transferring data to a PC or LIMS.
- Limitations: Their primary limitation is their lack of portability, requiring samples to be brought to the lab for analysis. They also represent a moderate to high initial investment.
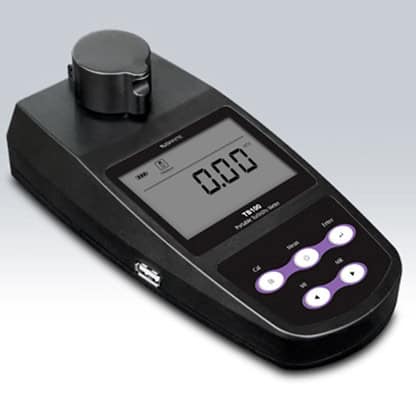
4.2. Portable Turbidity Meters: Precision in the Field
Portable turbidity meters are compact, lightweight, and battery-powered handheld instruments engineered for on-site analysis. They are indispensable tools for environmental scientists, water treatment plant operators, and field technicians who need immediate results.
- Advantages: Their main benefit is convenience and flexibility. They allow for rapid analysis directly at the sampling source—be it a river, a treatment tank, or a distribution point—eliminating sample degradation issues that can occur during transport. Modern portable units are rugged, often waterproof (IP67 rated), and offer accuracy that rivals many benchtop models.
- Limitations: While highly accurate, they may not match the ultimate precision of the highest-end benchtop models. They are also dependent on battery life and typically have smaller sample cells, which can be a consideration for sample representativeness.
4.3. Online (Process) Turbidity Meters: The Key to Automation
Online, or process, turbidity meters are designed for permanent installation directly within a water system, such as a pipe, channel, or tank, to provide continuous, unattended measurements.
- Advantages: Their greatest strength is providing a real-time, continuous stream of data. This enables proactive process control and automation. An online meter can be integrated with a plant’s Supervisory Control and Data Acquisition (SCADA) system to automatically trigger alarms, adjust chemical dosing pumps, or initiate backwash cycles. This eliminates the potential for human sampling error and provides a complete, dynamic picture of the process, rather than isolated snapshots.
- Limitations: Online meters represent the highest initial investment in terms of equipment and installation. They also require a robust maintenance schedule to prevent sensor fouling and ensure continued accuracy in a demanding, continuous-flow environment.
The choice between these instrument types reflects a fundamental difference in quality control philosophy. Benchtop and portable meters support a reactive, “snapshot” approach to monitoring. An operator analyzes a grab sample and learns about the water quality at that specific moment in time—a “photograph” of the process. This is essential for compliance checks and field surveys, but it means that a process upset might not be detected until the next scheduled sample is taken.
In contrast, an online meter enables a proactive, “continuous movie” approach. By providing a constant data stream, it allows operators to observe trends. They can see turbidity levels slowly rising and can schedule a filter backwash before a compliance limit is breached or product quality is compromised. This ability to anticipate and prevent problems, rather than simply reacting to them, is the core value proposition of online monitoring and often justifies the higher initial investment by preventing costly process failures and optimizing resource use.
Table 2: Feature Comparison of Turbidity Meter Types
| Feature | Benchtop Meter | Portable Meter | Online (Process) Meter |
| Primary Use Case | High-precision laboratory analysis, research, compliance reporting | Field analysis, on-site spot-checking, environmental monitoring | Continuous, real-time process monitoring and control |
| Accuracy/Precision | Highest | Good to High | High |
| Portability | None (Stationary) | High (Handheld) | None (Fixed Installation) |
| Data Management | Advanced (GLP compliance, PC connectivity, large storage) | On-board data logging, sometimes with USB/wireless transfer | Real-time output to SCADA, PLC, or data loggers |
| Cost | Medium to High | Low to Medium | High |
| Typical Application | Final drinking water compliance testing, beverage quality assurance, scientific research | River and lake health assessment, water distribution network checks, treatment process spot checks | Automated control of coagulation dosing, filter effluent monitoring, industrial effluent discharge |
Section 5: Turbidity Measurement in Action: Key Applications Across Industries
The versatility and importance of turbidity measurement are best understood by examining its role in various critical applications.
5.1. Drinking Water Production: A Guardian of Public Health
In drinking water treatment, turbidity is arguably the single most important physical parameter measured. It is monitored at every stage of the process to ensure both efficiency and safety.
- Source Water Monitoring: Raw water from rivers or reservoirs is monitored for turbidity to anticipate the required level of treatment. A sudden spike after a storm event alerts operators to adjust chemical dosages to handle the increased particle load.
- Coagulation and Flocculation Optimization: Chemicals called coagulants are added to the water to cause small particles to clump together into larger, heavier “flocs.” By measuring the turbidity of the water after this stage, operators can optimize the chemical dose, ensuring effective particle removal without wasting expensive chemicals.
- Filter Effluent Monitoring: This is the most critical regulatory control point. After the water passes through large filters (e.g., sand or membrane), online turbidity meters continuously monitor the effluent. A stable, low turbidity reading confirms that the filters are effectively removing particles, including chlorine-resistant pathogens like Cryptosporidium. The US EPA requires the combined filter effluent to remain below 0.3 NTU, and individual filter lines must often stay below 0.15 NTU. A sudden increase triggers an alarm, indicating a potential filter breakthrough that requires immediate attention.
- Filter Backwash Optimization: Filters are cleaned periodically through a process called backwashing. A turbidity meter on the backwash discharge line can determine precisely when the filter is clean. This allows the process to be stopped, preventing the waste of large volumes of treated water and avoiding damage to the filter media from excessive washing.
5.2. Wastewater Management: Protecting Our Waterways
In wastewater treatment, turbidity measurement is essential for process control and ensuring that the final effluent discharged back into the environment is safe.
- Process Efficiency: Turbidity is monitored at various points to gauge the effectiveness of treatment stages like primary sedimentation (where heavy solids settle out) and secondary biological treatment.
- Effluent Compliance: Regulatory agencies set strict limits on the turbidity or TSS of treated wastewater to protect the receiving rivers or lakes. Continuous online monitoring of the final effluent ensures compliance and provides a permanent record for reporting.
- Early Warning System: An unexpected spike in turbidity can serve as an early warning of a problem within the plant, such as an equipment malfunction or a toxic shock to the biological treatment process. It can also indicate an unusual or illegal industrial discharge into the municipal sewer system.
5.3. Environmental Science: Assessing Ecosystem Health
For environmental scientists and ecologists, turbidity is a key indicator of the health of aquatic ecosystems.
- Monitoring Runoff and Erosion: Portable turbidity meters are used extensively to monitor rivers and lakes. Elevated turbidity levels are often a direct result of sediment runoff from construction sites, agricultural land, or areas impacted by deforestation and erosion. This data is crucial for watershed management and assessing the impact of land use changes.
- Assessing Aquatic Life Impact: As previously noted, high turbidity directly harms aquatic life by reducing light for photosynthesis, increasing water temperature, and physically damaging fish and their habitats. Turbidity monitoring is a fundamental part of any comprehensive water quality assessment program.
5.4. Industrial Quality Control: Ensuring Product Consistency
In many industries, clarity is a critical component of product quality and process efficiency.
- Beverage Industry: Turbidity meters are used to measure the haze in beer and wine, ensuring a consistent and appealing final product. They also monitor the quality of the source water used in bottled water and soft drinks, where any visible cloudiness is unacceptable to consumers.
- Pharmaceutical Manufacturing: The clarity of injectable drugs and other pharmaceutical solutions is a critical quality attribute directly related to patient safety. Online turbidity meters are integrated into production lines to continuously monitor solutions, verify the effectiveness of microfiltration steps, and ensure compliance with strict pharmacopeial standards.
- Aquaculture: In fish farming, water clarity is vital. High turbidity can indicate stressful conditions for the fish, such as excess waste, sediment disturbance, or the beginning of a harmful algal bloom. Turbidity monitoring helps farmers maintain optimal growing conditions.
Section 6: Best Practices for Accurate and Repeatable Measurements
An accurate turbidity measurement is the result of a well-maintained instrument, proper calibration, and meticulous sample handling. Neglecting any of these areas can introduce significant errors, rendering the data unreliable.
6.1. The Foundation of Accuracy: Calibration
Calibration is the process of adjusting the meter’s response to match known standards. It is the single most important procedure for ensuring data accuracy.
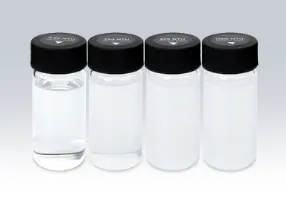
- Primary Standards: The universally accepted primary standard for turbidity is Formazin, a polymer suspension created by a precise chemical reaction between hydrazine sulfate and hexamethylenetetramine. While highly reproducible, lab-prepared formazin has a limited shelf life, especially at low concentrations.
- Stabilized Standards: For convenience and improved stability, most users now rely on commercially prepared primary standards. These include stabilized formazin suspensions (like StablCal®) and suspensions of styrene divinylbenzene (SDVB) polymer beads (like AMCO-AEPA-1). These standards are recognized by the EPA as equivalent to formazin, are pre-diluted to specific values, and have a much longer shelf life, reducing preparation errors.
- General Calibration Procedure:
- Always follow the specific instructions in the instrument’s user manual.
- Allow the instrument to warm up for the recommended time (often 30-60 minutes) to ensure the light source has stabilized.
- Begin with a “zero” or “blank” calibration using turbidity-free water (high-purity deionized water, often passed through a 0.2 µm filter).
- Perform a single-point or multi-point calibration using one or more primary standards of known value (e.g., 20 NTU for a single-point calibration, or a series like 0.1, 20, 100, and 800 NTU for a multi-point calibration).
- Before use, gently invert the standard vial several times to ensure the polymer particles are uniformly suspended. Do not shake vigorously, as this will create microbubbles that cause erroneous readings. Allow the standard to sit for a minute to let any bubbles dissipate.
- Calibration Frequency: For regulatory purposes, a full calibration with primary standards should be performed at least quarterly. The calibration should be verified more frequently (weekly or even daily) using a secondary standard or by checking against a recently calibrated laboratory meter.
6.2. Mastering the Sample: Cuvette and Sample Handling
The cuvette is part of the instrument’s optical system. Any imperfections or contaminants on its surface will interfere with the measurement.
- Cuvette Cleanliness and Condition: Cuvettes must be kept scrupulously clean, inside and out. Fingerprints, smudges, dirt, and condensation will scatter light and cause falsely high readings. Always handle the cuvette by its cap or the top edge. Before inserting it into the meter, wipe the outside with a soft, lint-free cloth. Any cuvette that becomes scratched or etched should be discarded immediately.
- Oiling the Cuvette: To mask minor, unavoidable scratches on the glass surface, a thin, uniform layer of silicone oil can be applied. The oil has the same refractive index as glass, which helps the light pass through without being scattered by the imperfections. Apply a few drops and wipe thoroughly with a lint-free cloth until the surface appears dry.
- Indexing the Cuvette: Minor variations in the glass of a cuvette mean that it will give slightly different readings depending on its orientation in the light path. For the highest precision, “index” the cuvette by marking it and the meter’s sample holder so that it is inserted in the exact same orientation for every measurement (blank, standard, and sample).
- Sample Preparation and Degassing: Collect a representative sample and gently invert the cuvette to ensure particles are evenly distributed. Avoid vigorous shaking, which creates persistent microbubbles. Air bubbles are a major source of positive interference.15 To remove them, allow the sample to stand for a few minutes before measurement, or apply a gentle vacuum. For online meters, a properly designed bubble trap or debubbler is essential.
6.3. Troubleshooting Common Problems
When readings are unstable or inaccurate, a systematic approach can quickly identify the cause.
- Problem: Unstable or Drifting Readings
- Common Causes: Particles settling out of suspension in the cuvette; air bubbles slowly rising; temperature differences causing condensation or convection currents; dirty instrument optics.
- Solutions: Gently invert the sample immediately before taking a reading. Degas the sample. Use the instrument’s signal averaging feature, if available, which takes multiple readings and averages them for a more stable result. Allow cold samples to warm to room temperature to prevent condensation.
- Problem: Inaccurate Readings (Consistently High or Low)
- Common Causes: Dirty, smudged, or scratched cuvette; incorrect or expired calibration standards; instrument not properly calibrated; sample color interfering with an EPA-method (white light) meter; stray light inside the instrument.
- Solutions: Meticulously clean, dry, and oil the cuvette. Verify the calibration using fresh, certified primary standards. If measuring a colored sample, use an ISO 7027-compliant (infrared) meter if possible. Ensure the instrument’s sample chamber lid is always closed during measurement to block ambient light.
- Problem: Calibration Failure
- Common Causes: Using expired or contaminated standards; using the wrong standards for the instrument (e.g., standards for an IR meter with a white light meter); a contaminated or poor-quality blank (turbidity-free water); severely fouled instrument optics.
- Solutions: If in doubt, reset the meter to its factory default calibration. Obtain a fresh set of certified primary standards appropriate for the instrument model. Use high-purity, filtered, deionized water for the blank. If problems persist, the instrument may require professional service and cleaning.
Conclusion: The Indispensable Role of the Turbidity Meter
The turbidity meter stands as a fundamental analytical instrument, offering a rapid, reliable, and powerful method for quantifying the clarity of water and other liquids. While the principle is simple—measuring the scattering of light by suspended particles—the insights gained are profound and far-reaching.
This single optical measurement provides actionable intelligence that is critical across a vast spectrum of applications. It is a frontline guardian of public health, ensuring the effectiveness of filtration and disinfection processes that produce safe drinking water. It is a vital tool for environmental stewardship, helping scientists track the health of our rivers and lakes and assess the impact of human activity on delicate aquatic ecosystems. And it is a cornerstone of industrial quality control, safeguarding the consistency and purity of countless products, from beverages to life-saving pharmaceuticals.
The effectiveness of this tool, however, is directly tied to the knowledge of the user. Selecting the right instrument—be it a high-precision benchtop model, a rugged portable unit, or an automated online sensor—is the first critical step. This choice must be informed by the specific application, the nature of the sample, and the governing regulatory standards. Subsequently, achieving reliable and repeatable data depends on a commitment to best practices: meticulous calibration with proper standards, careful sample and cuvette handling, and a systematic approach to troubleshooting. By mastering both the principles and the practice of turbidity measurement, professionals in science and industry can harness the full power of this essential instrument to ensure quality, protect health, and preserve our environment.
If you are ready to find the right Turbidity Meter for your laboratory, please browse our complete product range: Turbidity Meter
This guide is maintained by HINOTEK’s core technical team, comprised of senior engineers and application scientists with over two decades of hands-on experience in fields such as microscopy, centrifugation, and spectrophotometry. We are committed to ensuring that every piece of information in this guide—from instrument principles and technical specifications to laboratory procurement advice—maintains the highest level of accuracy and timeliness.
This content is regularly reviewed and updated to reflect the latest industry standards and technological advancements. We value feedback from the global scientific community. Should you have any questions or suggestions, or wish to discuss any technical details, please do not hesitate to contact our expert team at [email protected].
Works cited
- Turbidimeter – Water Testing – Lovibond, https://www.lovibond.com/usa-en/PM/Water-Testing/Products/Lab-Portable-Instruments/Turbidimeter
- Turbidity measurement and monitoring in water quality analysis,https://www.ysi.com/parameters/turbidity
- Turbidity Fact Sheet – State Water Resources Control Board – CA.gov, https://www.waterboards.ca.gov/water_issues/programs/swamp/docs/cwt/guidance/3150en.pdf
- Turbidity | EPA, https://www.epa.gov/system/files/documents/2021-07/parameter-factsheet_turbidity.pdf
- www.montclair.edu, https://www.montclair.edu/water-science/environmental-services/turbidity/#:~:text=Turbidity%20is%20a%20measure%20of,the%20color%20of%20the%20water.
- Why Measure Turbidity? – Montclair State University, https://www.montclair.edu/water-science/environmental-services/turbidity/
- Turbidity Measurement – OMEGA ENGINEERING, https://mx.omega.com/techref/ph-6.html
- Guidance Manual for Compliance with the Surface Water Treatment Rules: Turbidity Provisions – EPA, https://www.epa.gov/sites/default/files/2020-06/documents/swtr_turbidity_gm_final_508.pdf
- The Important Role of Process Turbidimeters in Water Quality Measurement – Lovibond, https://www.lovibond.com/usa-en/water-testing/support-service/knowledge-base2/turbidity-measurement/the-important-role-of-process-turbidimeters-in-water-quality-measurement