 |
Gas chromatography (GC) (View HINOTEK Gas chromatography Category) is a powerful analytical chemistry technique used in laboratories to separate, identify, and quantify the individual chemical components within a sample mixture. It is a foundational method, essential in fields ranging from environmental monitoring to pharmaceutical quality control.
For a substance to be analyzed by GC, it must meet two fundamental criteria: it must be volatile, meaning it can be easily vaporized into a gaseous state, and it must be thermally stable, meaning it will not decompose or break down at the high temperatures required for the analysis. This typically limits the technique to compounds with a molecular weight below 1250 Da. These constraints are the primary factor that distinguishes gas chromatography from its main counterpart, high-performance liquid chromatography (HPLC). The physical properties of the sample dictate the choice of technology, making the decision of whether a compound is suitable for GC the first and most critical step for any analyst.
The process involves injecting a small amount of a liquid or gaseous sample into the instrument. The sample is heated and vaporized, then swept by an inert gas through a long, thin tube known as a column. Inside the column, the different components of the mixture are separated. As each separated component exits the column, it is measured by a detector.
The Core Principle: How Gas Chromatography Separates a Mixture
Gas chromatography separates compounds by taking advantage of how they partition, or distribute themselves, between two different phases: a mobile phase and a stationary phase. Understanding this dynamic interaction is key to understanding how the separation works.
- The Mobile Phase: This is an inert, or non-reactive, gas that flows continuously through the instrument. Common choices include helium, hydrogen, or nitrogen. This “carrier gas” has one job: to transport the vaporized sample molecules through the system. Unlike in some other forms of chromatography, the mobile phase in GC does not interact chemically with the sample components.
- The Stationary Phase: This is a microscopic layer of a non-volatile liquid or a polymer that is coated onto the inner surface of a long, narrow tube called the column. The chemical nature of this phase is carefully chosen for the specific separation required.
Here’s how it works. When the vaporized sample mixture is introduced into the carrier gas stream, it is carried into the column. As the mixture travels through the column, its components are in a constant state of flux, moving between being carried along by the mobile gas phase and interacting with the stationary liquid phase. This is the process of partitioning.
The separation is not a single event but a dynamic equilibrium that occurs continuously along the entire length of the column. Think of it as millions of tiny, rapid liquid-gas extractions happening one after another. A compound that is more “soluble” or has a higher affinity for the stationary phase will be held back slightly at every point. Over the length of a 30-meter column, these minuscule delays accumulate, resulting in a significant difference in the total time spent in the column.
This separation is governed by two main properties of the sample components:
- Boiling Point (Volatility): Compounds with a lower boiling point are more volatile. They spend more time in the gaseous mobile phase and are carried through the column more quickly. Compounds with a higher boiling point are less volatile and spend more time condensed in the liquid stationary phase, so they move more slowly.
- Specific Interactions (Polarity): The chemical properties of the stationary phase are critical. Based on the principle of “like dissolves like,” compounds that are chemically similar to the stationary phase (e.g., a polar compound in a polar stationary phase) will have stronger intermolecular interactions. These stronger interactions cause them to be retained longer in the stationary phase, slowing their journey through the column.
Because every chemical compound has a unique combination of boiling point and interaction affinity with a given stationary phase, each one travels through the column at a distinct, reproducible speed. This difference in speed causes the components of the initial mixture to separate into discrete bands. They exit the column one by one, where they can then be detected and measured. The time it takes for a specific compound to travel from the injector to the detector is called its retention time (Rt), a key characteristic used for identification.
Anatomy of a Gas Chromatograph: A Tour of the Instrument
A gas chromatograph is not a single device but an integrated system of modules, each performing a specific function. The performance of the entire system depends on how well these components work together. For laboratory managers and procurement specialists, understanding this modularity is key to building a balanced system where the inlet, column, and detector are all appropriate for the intended application, rather than simply choosing the “best” component in isolation.
The Gas Supply: Carrier Gas System
The carrier gas system provides a constant and pure flow of the mobile phase. Gas purity is critical for good results. Carrier gases should be at least 99.995% pure, as impurities like oxygen and moisture can rapidly degrade the sensitive stationary phase of the column, leading to a noisy signal (high baseline bleed) and shortened column lifetime.
- Common Carrier Gases:
- Helium: The most widely used carrier gas. It is inert, safe, and compatible with almost all detectors.
- Hydrogen: Offers the highest speed and separation efficiency (resolution). However, it is flammable and requires stringent safety measures in the lab.
- Nitrogen: An economical choice that provides good resolution but is significantly slower than helium or hydrogen.
Modern gas chromatographs use electronic pneumatic control (EPC) to precisely regulate gas pressures and flow rates. This allows for advanced techniques like creating pressure programs that can speed up analysis or improve separation.
The Injection Port (Inlet): Introducing the Sample
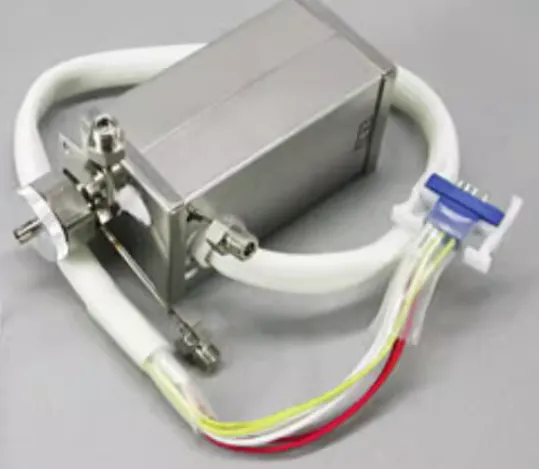 |
The inlet, or injection port, has one primary function: to vaporize the liquid sample instantly and introduce it into the carrier gas stream as a tight, narrow band. To achieve this, the inlet is heated to a temperature typically 50 °C higher than the boiling point of the sample’s least volatile component. Inside the inlet is a disposable glass tube called an inlet liner. This is where the sample vaporization occurs. The condition of the liner is critical; a dirty or chemically active liner is one of the most common sources of analytical problems, including poor peak shape (tailing) and non-reproducible results. Some liners are packed with quartz wool, which aids in vaporization and acts as a trap for non-volatile residues from “dirty” samples, protecting the column.
Split vs. Splitless Injection: A Critical Choice
The two most common injection techniques are split and splitless, and the choice depends entirely on the concentration of the analytes in the sample.
- Split Injection: This method is used for high-concentration samples. After the sample is injected and vaporized, the carrier gas flow is split. A large portion of the sample vapor (e.g., 98%) is vented to waste, while only a small, representative fraction (e.g., 2%) is directed into the column. This prevents the column from being overloaded, which would result in broad, distorted peaks. The ratio of the vented flow to the column flow is called the split ratio.
- Splitless Injection: This method is used for trace analysis, where analyte concentrations are very low. During the injection, the split vent is closed, and the entire vaporized sample is slowly transferred onto the column to ensure maximum sensitivity. After a short period (typically 30-60 seconds), the vent is opened to flush any remaining solvent vapor from the inlet. This technique requires careful optimization to avoid broad peaks, especially for highly volatile compounds.
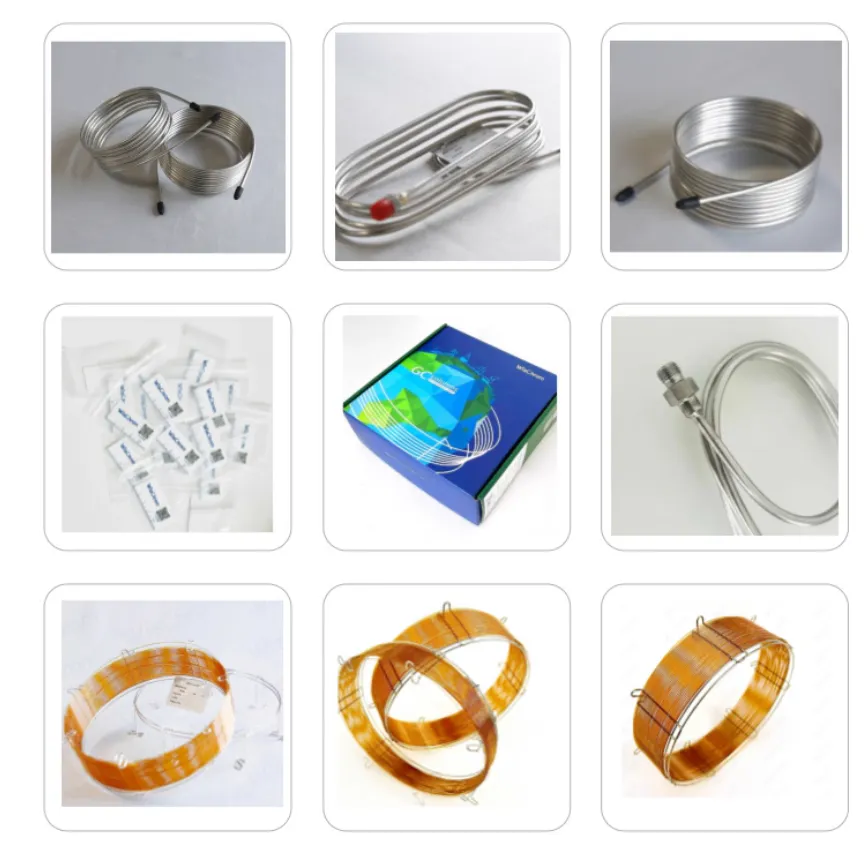
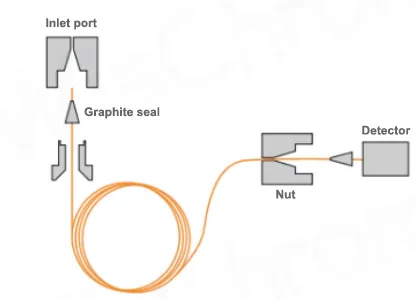
The GC Column: The Heart of the Separation
The column is where the separation happens. It is a long, thin tube housed inside the GC oven.
 |
 |
- Capillary vs. Packed Columns:
- Capillary Columns: These are the modern standard for nearly all applications. They are made of fused quartz (a high-purity glass), very long (15 to 100 meters) and narrow (0.1 to 0.53 mm internal diameter). The stationary phase is a thin film coated directly onto the inner wall. This design provides extremely high separation efficiency and resolution.
- Packed Columns: These are an older technology, consisting of shorter, wider metal or glass tubes packed with a solid support material that is coated with the liquid stationary phase. They offer much lower resolution but can handle larger sample volumes. Today, they are used mainly for specific applications like separating permanent gases.
- Choosing the Stationary Phase: The selection of the stationary phase is the most important decision in developing a GC method. The choice is based on the polarity of the compounds being analyzed. Common stationary phases include:
- Non-polar: Phases like polydimethyl siloxane (e.g., DB-1, HP-5ms) are general-purpose and work well for non-polar compounds like hydrocarbons.
- Polar: Phases like polyethylene glycol (e.g., WAX, Carbowax) are used for polar compounds like alcohols, acids, and esters.
The GC Oven: Controlling the Analysis with Temperature
The column is housed in a programmable oven that allows for precise temperature control. Temperature is the most powerful variable for controlling how long compounds are retained in the column.
- Isothermal Analysis: The oven is held at a single, constant temperature throughout the analysis. This is suitable for simple mixtures where all components have similar boiling points and elute within a short time frame.
- Temperature Programming: This is the more common and powerful approach, especially for complex samples. The analysis starts at a low oven temperature, which is then increased at a controlled rate (a “ramp”) to a final higher temperature. This allows for the effective separation of a wide range of compounds in a single run.
The advantages of temperature programming are significant:
- Improved Resolution: It allows for the separation of very volatile (low-boiling) compounds at the beginning of the run while still being able to elute very non-volatile (high-boiling) compounds at the end.
- Faster Analysis: High-boiling compounds elute much faster as the temperature increases, which can dramatically shorten the total run time compared to an isothermal analysis.
- Better Peak Shape and Sensitivity: In an isothermal run, late-eluting peaks become very broad and flat. Temperature programming keeps all peaks relatively sharp and narrow, which makes them taller and easier to detect and quantify, thus increasing sensitivity.
The Detector: Seeing the Separated Compounds
As each separated compound exits the column, it passes through a detector. The detector generates an electrical signal that is proportional to the amount of the compound present. The choice of detector depends on the application, the required sensitivity, and the types of compounds being analyzed.
The table below compares the most common GC detectors, providing a quick reference for selecting the right tool for a given analytical task. This is a critical decision for any lab, as the detector determines what can be measured and at what concentration.
Table 1: Comparison of Common GC Detectors
| Detector | Working Principle | Specificity | Sensitivity | Destructive? | Common Applications/Analytes |
| Flame Ionization Detector (FID) | Burns organic compounds in a hydrogen/air flame, creating ions that generate a current. | Selective for carbon-containing compounds. Does not respond to water, CO2, or permanent gases. | High (~0.1 ng) | Yes | Most organic compounds, hydrocarbons, pharmaceuticals, food analysis. |
| Thermal Conductivity Detector (TCD) | Measures the change in thermal conductivity of the carrier gas as an analyte passes over a heated filament. | Universal. Detects any compound that has a different thermal conductivity than the carrier gas. | Low (~10 ng) | No | Permanent gases (O2, N2, CO2), water, light hydrocarbons, gas analysis. |
| Electron Capture Detector (ECD) | Measures the capture of electrons by electrophilic compounds (e.g., those with halogens) from a low-level radioactive source. | Highly selective for compounds with high electron affinity. | Very High (~0.01 pg) | No | Halogenated compounds (pesticides, PCBs), environmental analysis, organometallics. |
| Mass Spectrometer (MS) | Ionizes eluting compounds and separates the resulting fragments based on their mass-to-charge () ratio. | Universal. Provides a mass spectrum that acts as a “molecular fingerprint” for definitive identification. | Very High | Yes | Definitive identification of unknown compounds, complex mixture analysis, forensics, environmental, pharmaceuticals. |
The Power of Mass Spectrometry (GC-MS)
Coupling a gas chromatograph with a mass spectrometer (GC-MS) creates one of the most powerful analytical tools available. The GC performs the separation, and the MS acts as the detector. It provides not just a signal but detailed structural information for each peak. This allows for the confident identification of unknown compounds by matching their mass spectra to extensive digital libraries.
The final component is a computer with specialized software that controls the entire GC system, records the signal from the detector, and processes the data. The output is a graph called a chromatogram.
- The x-axis represents the retention time.
- The y-axis represents the intensity of the detector’s signal.
Each peak in the chromatogram corresponds to a single, separated component of the original mixture.
- Qualitative Analysis (Identification): The position of the peak on the x-axis—its retention time—is used to identify the compound, typically by comparing it to the retention time of a known standard analyzed under the same conditions.
- Quantitative Analysis (Quantification): The area under the peak is directly proportional to the amount of that compound in the sample. By calibrating the instrument with standards of known concentrations, the exact amount of each component can be determined.
Putting It into Practice: A General GC Workflow
Successful GC analysis is methodical. While the instrument run is automated, the quality of the final data depends heavily on the preparation and setup that precede it. Errors made in sample preparation or instrument configuration are the most frequent cause of poor results. This underscores the importance of robust Standard Operating Procedures (SOPs) for every step of the process.
Step 1: Sample Preparation
The goal of sample preparation is to extract the compounds of interest (analytes) from the sample matrix (e.g., soil, blood, food) and prepare them in a form suitable for injection.
- Extraction: This step isolates the analytes from the bulk of the sample. Common techniques include:
- Liquid-Liquid Extraction (LLE): Using a solvent to pull analytes from a liquid sample.
- Solid-Phase Extraction (SPE): Using a solid sorbent material to selectively trap analytes while interferences are washed away.
- Solid-Phase Microextraction (SPME): A solvent-free technique where a coated fiber adsorbs volatile analytes from the sample’s headspace or directly from a liquid, which is then transferred to the GC inlet.
- Purification/Cleanup: This removes interfering substances that might co-elute with the analytes or contaminate the GC system.
- Derivatization: Some compounds, like sugars or certain pharmaceuticals, are not volatile enough for GC analysis. Derivatization is a chemical reaction that converts these compounds into a more volatile form, making them suitable for GC.
Step 2: Instrument Setup and Method Development
Before running samples, the instrument must be properly configured. This involves a series of checks and parameter settings.
- Check Gas Supplies: Ensure carrier and detector gas cylinders have sufficient pressure and that gas purification traps are not exhausted.
- Install the Column: Select the appropriate column for the analysis. Trim a small piece from each end to ensure a clean, square cut. Install the column in the inlet and detector using the correct ferrules, ensuring it is inserted to the proper depth to avoid leaks or dead volume.
- Set Method Parameters: In the control software, program the analytical method. This includes setting the inlet temperature and split ratio, the oven temperature program (initial temperature, ramp rates, final temperature), the carrier gas flow rate, and all detector-specific parameters.
- Condition the Column: Before analyzing samples, it is good practice to condition a new column (or one that has been sitting unused) by heating it to a high temperature with carrier gas flowing to bake out any contaminants.
Step 3: Running the Analysis and Data Acquisition
- Prepare the Sequence: Load the prepared samples, along with any calibration standards and quality control samples, into vials and place them in the autosampler tray.
- Create the Sequence Table: In the software, create a sequence list that tells the instrument which vial to inject, what analytical method to use, and what to name the resulting data file for each run.
- Start the Run: Initiate the sequence. The autosampler will automatically inject each sample in order, and the data system will acquire and save the chromatogram for each run.
Step 4: Data Analysis and Quantification
After the sequence is complete, the data is processed.
- Qualitative Analysis (What is it?): The retention times of the peaks in the sample chromatograms are compared to those of known reference standards. If a peak in the sample has the same retention time as a standard, it is a potential identification. For GC-MS data, the mass spectrum of the unknown peak is compared against a spectral library for a much more confident identification.
- Quantitative Analysis (How much is there?): To determine the concentration of an analyte, a calibration curve is first generated by running a series of standards at known concentrations. A graph of peak area versus concentration is plotted. The peak area of the analyte in the unknown sample is then used to calculate its concentration from this calibration curve.
Troubleshooting Common GC Problems
Even with careful preparation, issues can arise. A logical approach to troubleshooting involves isolating the problem to one of the five main system areas: Injector, Flow, Column, Detector, or Electronics. Most problems are not sudden instrument failures but rather the result of the slow degradation of consumable parts like the inlet liner, septum, column, or gas filters. This means that the best troubleshooting tool is often a proactive and consistent maintenance schedule.
The following table outlines common symptoms, their likely causes, and recommended solutions.
Table 2: GC Troubleshooting Guide
| Symptom | Potential Cause (Component) | Solution |
| Peak Tailing (Asymmetric peaks with a drawn-out tail) | Injector: Active sites in a dirty liner; sample adsorption. Column: Degradation of the stationary phase; contamination at the column head. Flow Path: Dead volume from an improper column connection. | Clean or replace the inlet liner. Use a deactivated (silanized) liner for active compounds. Trim 10-20 cm from the front of the column. Re-install the column, ensuring the correct ferrule and insertion depth. |
| Peak Fronting (Asymmetric peaks with a sloping front) | Column: Column overload due to a sample that is too concentrated. Injector: Mismatch between the polarity of the injection solvent and the stationary phase. | Dilute the sample or reduce the injection volume. Increase the split ratio to introduce less sample onto the column. Change the injection solvent to one that is more compatible with the stationary phase. |
| Baseline Drift/Rise (Signal increases steadily during the run) | Column: Column bleed due to operating at too high a temperature or oxygen damage. Gas Supply: Contaminated carrier gas from an impure source or exhausted gas trap. System: Contamination buildup in the injector or detector. | Condition the column overnight. Perform a leak check on the entire system. Replace gas traps or the gas cylinder. Clean the injector and detector. |
| Ghost Peaks (Extra, unexpected peaks in the chromatogram) | Injector: Carryover from a previous, highly concentrated injection; degradation of the rubber septum (septum bleed). System: Contamination in the carrier gas line, sample vials, or solvent. | Run a solvent blank to wash the system. Replace the septum with a high-quality, low-bleed type. Use fresh, high-purity solvents and clean vials. |
| Shifting Retention Times (Peaks elute earlier or later than expected) | Gas Supply: A leak in the system causing a drop in pressure/flow; inconsistent flow from the controller. Oven: Incorrect or unstable oven temperature. Column: Stationary phase has been damaged or stripped, changing its retentive properties. | Perform a leak check, especially at the inlet fittings. Verify the actual oven temperature with a calibrated probe. Trim the column or replace it if it is old or heavily used. |
Gas Chromatography in Action: Key Industrial Applications
The true value of gas chromatography lies in its ability to provide definitive, quantitative certainty for volatile and semi-volatile compounds, even when they are present in highly complex mixtures. This capability is critical for ensuring safety, quality, and regulatory compliance across numerous industries.
Environmental Monitoring
GC is a frontline tool for environmental agencies and consulting labs to identify and quantify pollutants in air, water, and soil.
- Air Quality: Analysis of air samples for Volatile Organic Compounds (VOCs) like benzene and toluene, which are emitted from industrial processes and vehicle exhaust.
- Water Purity: Detecting trace levels of pesticide residues, industrial solvents, and petroleum hydrocarbons in drinking water, groundwater, and wastewater.
- Soil and Waste: Identifying and quantifying persistent organic pollutants (POPs) like polycyclic aromatic hydrocarbons (PAHs) and polychlorinated biphenyls (PCBs) in contaminated land and hazardous waste sites.
Food and Beverage Analysis
In the food industry, GC is indispensable for quality control, safety assurance, and product development.
- Flavor and Aroma Profiling: Identifying the specific volatile compounds that give foods and beverages their characteristic aroma and taste, such as in coffee, wine, or spices. This is crucial for consistency and authenticity testing.
- Food Safety: Screening agricultural products like fruits, vegetables, and grains for pesticide residues to ensure they comply with government safety limits.
- Quality Control: Analyzing the fatty acid profile of edible oils to detect adulteration (e.g., mixing expensive olive oil with cheaper oils) or to quantify trans fats.
Pharmaceuticals and Drug Analysis
GC plays a vital role in the pharmaceutical industry to ensure the purity, safety, and efficacy of medications from development through to production.
- Residual Solvent Analysis: Quantifying trace amounts of organic solvents (e.g., ethanol, acetone) that are used in the drug manufacturing process and can remain in the final product. Regulatory bodies set strict limits for these solvents.
- Impurity Profiling: Identifying and measuring trace impurities or degradation products in Active Pharmaceutical Ingredients (APIs) and finished drug products. This is critical for ensuring drug stability and safety.
- Pharmacokinetic Studies: Measuring the concentration of drugs and their metabolites in biological samples like blood or urine to understand how a drug is absorbed, distributed, metabolized, and excreted by the body.
Forensic Science
GC is a cornerstone technique in forensic laboratories for the analysis of crime scene evidence.
- Arson Investigation: Analyzing fire debris for the presence of accelerant residues, such as gasoline or kerosene, to determine if a fire was deliberately set.
- Toxicology: Determining blood alcohol concentration in suspected drunk driving cases and screening biological samples for the presence of drugs, poisons, or toxins in postmortem investigations.
- Drug Seizures: Identifying and quantifying illicit drugs and controlled substances in powders, pills, or residues seized by law enforcement.
GC vs. HPLC: Choosing the Right Analytical Technique
While GC is a powerful and versatile technique, it is not suitable for all types of samples. The choice between Gas Chromatography (GC) and High-Performance Liquid Chromatography (HPLC) is determined almost entirely by the physical and chemical properties of the sample. They are complementary tools, not competitors, and a well-equipped laboratory often requires both to handle a diverse range of analytical challenges.
HPLC is the method of choice for compounds that are non-volatile, have a high molecular weight, or are thermally fragile, such as proteins, peptides, nucleic acids, and many pharmaceutical drugs.
The table below provides a direct comparison of the two techniques.
Table 3: GC vs. HPLC at a Glance
For over half a century, gas chromatography has been a cornerstone of the analytical laboratory. Its fundamental strengths—high separation efficiency, excellent sensitivity, speed, and versatility for volatile compounds—have made it an indispensable tool. Its reliability and robustness are proven in countless validated methods used for regulatory compliance and quality control worldwide.
Despite being a mature technology, GC is not static. The field continues to evolve with advancements like comprehensive two-dimensional gas chromatography (GC×GC), a technique that uses two different columns in series to provide a massive increase in separating power. This allows for the analysis of extremely complex samples, such as crude oil or environmental extracts containing thousands of individual compounds, that are impossible to resolve with conventional GC.
From protecting our environment by monitoring for pollutants to ensuring the safety and quality of our food and medicine, gas chromatography continues to play a critical role. It is both a reliable workhorse and a platform for future innovation, securing its place as an essential technique for modern analysis.
If you are ready to find the right Gas chromatography for your laboratory, please browse our complete product range: Gas chromatography
This guide is maintained by HINOTEK’s core technical team, comprised of senior engineers and application scientists with over two decades of hands-on experience in fields such as microscopy, centrifugation, and spectrophotometry. We are committed to ensuring that every piece of information in this guide—from instrument principles and technical specifications to laboratory procurement advice—maintains the highest level of accuracy and timeliness.
This content is regularly reviewed and updated to reflect the latest industry standards and technological advancements. We value feedback from the global scientific community. Should you have any questions or suggestions, or wish to discuss any technical details, please do not hesitate to contact our expert team at [email protected].
Works cited
- What is Gas Chromatography: How It’s Used and Why It Matters – Teledyne Labs, https://www.teledynelabs.com/products/chromatography/gc-prep/gas-chromatography
- Gas Chromatography – How a Gas Chromatography Machine Works, How To Read a Chromatograph and GCxGC – Technology Networks, https://www.technologynetworks.com/analysis/articles/gas-chromatography-how-a-gas-chromatography-machine-works-how-to-read-a-chromatograph-and-gcxgc-335168
- Gas Chromatography FAQs – Agilent, https://www.agilent.com/en/support/gas-chromatography/gas-chromatography-faqs
- www.agilent.com, https://www.agilent.com/en/product/gas-chromatography-mass-spectrometry-gc-ms/gcms-fundamentals#:~:text=Gas%20chromatography%20(GC)%20is%20used,gas%20like%20helium%20or%20hydrogen.
- cherokeetulsa.com, https://cherokeetulsa.com/what-is-gas-chromatography-and-how-does-gas-chromatography-work/#:~:text=The%20process%20of%20gas%20chromatography,detector%20where%20it%20is%20quantified.
- Gas Chromatography – Chemistry LibreTexts, https://chem.libretexts.org/Bookshelves/Analytical_Chemistry/Supplemental_Modules_(Analytical_Chemistry)/Instrumentation_and_Analysis/Chromatography/Gas_Chromatography
- Gas Chromatography: Principle, Parts, Steps, Procedure, Uses – Microbe Notes, https://microbenotes.com/gas-chromatography/
- PLease Explain Gas Chromatography : r/Mcat – Reddit, https://www.reddit.com/r/Mcat/comments/b7en1e/please_explain_gas_chromatography/
- What Is Gas Chromatography & How Does It Work? – Excedr, https://www.excedr.com/blog/what-is-gas-chromatography-how-does-it-work
- Gas chromatography – Wikipedia, https://en.wikipedia.org/wiki/Gas_chromatography