The Unseen World in a Beam of Light: A Comprehensive Guide to Nucleic Acid and Protein Measurement by Spectrophotometer
|
|
|


Introduction: The Workhorse of the Molecular Biology Lab
In the landscape of modern molecular biology, few instruments are as ubiquitous and indispensable as the spectrophotometer. From a researcher purifying a novel enzyme to a technician performing routine quality control on DNA extractions, this instrument serves as a fundamental workhorse, providing critical data on the concentration and purity of the invisible molecules of life. It is a cornerstone technology that underpins a vast array of downstream applications, including PCR, DNA sequencing, cloning, Western blotting, and enzyme kinetics. The accuracy of these subsequent, often complex and expensive, experiments hinges on the quality of the initial data obtained from this seemingly simple device.
This article aims to serve as a comprehensive and accessible guide for students, laboratory technicians, and researchers navigating the world of spectrophotometry. It will demystify the instrument’s inner workings, delve into the specific applications for quantifying nucleic acids and proteins, explore its use in monitoring microbial growth, and, most importantly, provide a practical framework of best practices and troubleshooting to ensure the generation of accurate, reliable, and reproducible data. By understanding not just how to use a spectrophotometer but why it works the way it does, users can unlock its full potential and avoid common pitfalls that can compromise their research.
Part 1: The Spectrophotometer – A Look Under the Hood
Before applying the spectrophotometer to biological samples, it is essential to understand the core principles that govern its operation. This foundational knowledge transforms the instrument from a “black box” into a transparent and predictable analytical tool.
1.1 The Guiding Principle: How We Measure the Invisible
At its heart, spectrophotometry is the quantitative measurement of how a chemical substance absorbs and transmits light over a specific range of wavelengths. The core principle is remarkably intuitive: different molecules in a solution absorb light of specific wavelengths to varying degrees. By shining a controlled beam of light through a sample and measuring the amount of light that is absorbed, we can deduce the concentration of the substance of interest.
|
|

A simple analogy can be found in a glass of tea or colored drink. If you shine a flashlight through a glass of very weak tea, most of the light will pass through to the other side. However, if you shine the same light through a glass of very strong, dark tea, the liquid will absorb much more of the light, and significantly less will emerge. The “darkness” of the tea is analogous to the concentration of molecules, and the amount of light that gets “eaten” by the solution is analogous to its absorbance. Spectrophotometry simply formalizes and quantifies this everyday phenomenon with high precision.
1.2 Anatomy of a Spectrophotometer: The Path of Light
A spectrophotometer is composed of several key components that work in concert to guide light from its source, through the sample, and to a detector. Understanding this light path is crucial for appreciating how measurements are made and what can go wrong.
 |
|
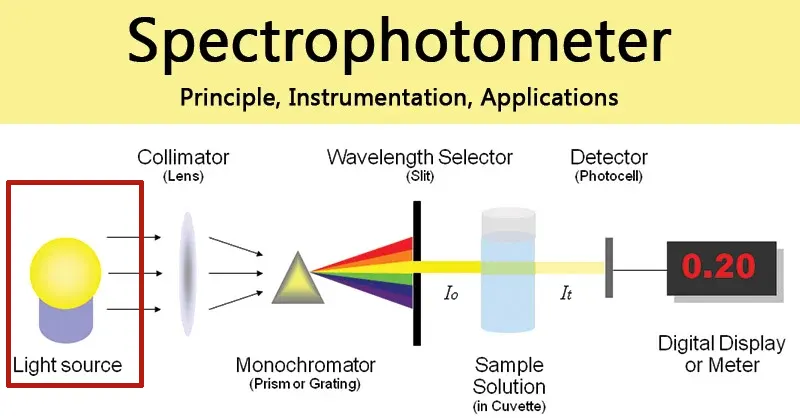
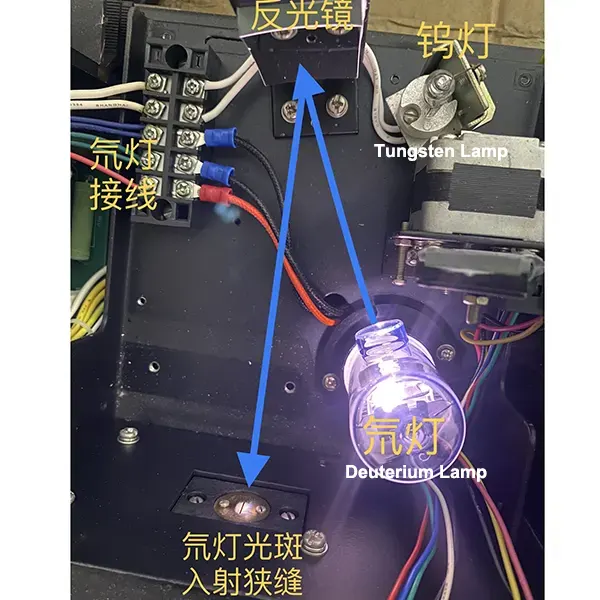
- Light Source: The journey begins with a lamp that produces a broad spectrum of light. Typically, instruments use a combination of lamps to cover the full ultraviolet (UV) and visible range. A deuterium lamp is used for the UV region (approximately 190-400 nm), which is critical for nucleic acid and protein analysis, while a tungsten-halogen lamp covers the visible and near-infrared regions (approximately 400-1100 nm).
- Monochromator: This component is the “wavelength selector” and is arguably the most sophisticated part of the instrument. The broad-spectrum light from the lamp enters the monochromator and strikes a dispersive element, which is either a prism or, more commonly, a diffraction grating. This element works like a prism splitting white light into a rainbow, separating the light into its constituent wavelengths. By precisely rotating the diffraction grating, only a very narrow band of a single, specific wavelength (e.g., 260 nm) is allowed to pass through an exit slit and proceed toward the sample.
- Sample Compartment and Cuvette: The selected beam of light passes into the sample compartment, where the sample is held in a transparent container called a cuvette. A standard cuvette is a small, rectangular vessel designed to have a precise light path length, which is the distance the light travels through the sample. This path length is typically standardized at 1 cm to ensure consistency and comparability of measurements between instruments.
- Detector: After passing through the sample, any light that was not absorbed strikes a detector, such as a photomultiplier tube (PMT) or a photodiode. This highly sensitive component converts the incoming photons of light into an electrical signal. The strength of this signal is directly proportional to the intensity of the light striking it.
- Display: The electrical signal from the detector is sent to a microprocessor, which converts it into a digital value that is displayed to the user, typically as either transmittance or absorbance.
A key distinction in instrument design is between single-beam and double-beam configurations. A single-beam spectrophotometer measures the light intensity of a reference solution (the “blank”) and the sample solution sequentially. A double-beam spectrophotometer, such as the HINOTEK L7 Double Beam Spectrophotometer, splits the light beam from the monochromator into two separate paths. One path goes through the reference cuvette, and the other simultaneously goes through the sample cuvette.6 This design offers a significant advantage: it provides real-time correction for any fluctuations in the lamp’s output or changes in the atmosphere, resulting in a much more stable baseline and higher accuracy, particularly for measurements taken over an extended period, like enzyme kinetics scans.
Table 1: Key Components of a Spectrophotometer and Their Functions
| Component | Function | Real-World Analogy |
| Light Source | Generates a broad spectrum of light (UV and visible). | A powerful, multi-color flashlight. |
| Monochromator | Selects a single, specific wavelength of light to pass through the sample. | A prism that isolates one specific color (e.g., pure red) from a rainbow. |
| Cuvette | A standardized, transparent container that holds the sample with a fixed path length. | The glass of tea with a specific, known width. |
| Detector | Measures the intensity of light that passes through the sample and converts it to an electrical signal. | A light meter measuring the brightness of the light that wasn’t blocked by the tea. |
| Display | Converts the electrical signal into a user-readable value (Absorbance). | The digital screen on the light meter showing a final reading. |
1.3 The Language of Light: Absorbance and Transmittance
Spectrophotometers report measurements in two primary ways: transmittance and absorbance. While related, scientists almost exclusively use absorbance for quantitative analysis.
- Transmittance (T) is the fraction of the original light that successfully passes through the sample. It is calculated as the ratio of the transmitted light intensity (I) to the incident light intensity (I0). It is often expressed as a percentage.T=I0/I
- Absorbance (A), sometimes called optical density (OD), is the amount of light that is absorbed by the sample. It is related to transmittance by a negative logarithmic relationship.10A=−log10(T)=−log10(I0I)
The reason absorbance is the preferred unit is fundamental to quantitative analysis. The relationship between a sample’s transmittance and its concentration is logarithmic (and thus non-linear). In contrast, the relationship between absorbance and concentration is directly linear. This linear relationship, described by the Beer-Lambert Law, makes it far simpler to create calibration curves and accurately calculate the concentration of an unknown sample. An absorbance of 0 corresponds to 100% transmittance (no light absorbed), while an absorbance of 1 corresponds to 10% transmittance (90% of the light absorbed).
1.4 The Beer-Lambert Law: The Mathematical Heart of Spectrophotometry
The Beer-Lambert Law (or Beer’s Law) is the simple yet powerful equation that forms the mathematical basis of spectrophotometry. It states that the absorbance of a solution is directly proportional to its concentration and the path length of the light through it. The law is expressed as:
A=ϵlc Where:
- A is the Absorbance measured by the instrument (it is a unitless value).
- ϵ (epsilon) is the molar absorptivity or extinction coefficient. This is a constant that is an intrinsic property of the molecule being measured. It describes how strongly that substance absorbs light at a specific wavelength. Its units (e.g., L⋅mol−1⋅cm−1) are such that they cancel out the units of path length and concentration, leaving absorbance unitless.
- l is the path length of the light through the sample, which is determined by the width of the cuvette. This is almost always standardized to 1 cm.
- c is the concentration of the substance in the solution (e.g., in mol⋅L−1). This is the value that researchers typically want to determine.
While elegant, the Beer-Lambert Law is not infallible. Its linear relationship holds true for most routine lab work but begins to break down at very high concentrations. When molecules are packed too closely together, their electrostatic interactions can alter their ability to absorb light. Furthermore, all spectrophotometers have a small amount of “stray light”—unwanted light of other wavelengths that reaches the detector. At high absorbances, where very little of the correct wavelength of light is being transmitted, this stray light becomes a significant fraction of the total light hitting the detector, causing the measured absorbance to be artificially low and deviate from linearity. For this reason, absorbance readings above a certain threshold (generally between 1.5 and 2.0) are considered unreliable, and such samples must be diluted into the linear range for an accurate measurement.
Part 2: Quantifying Nucleic Acids – The Cornerstone of Molecular Biology
The most frequent use of a spectrophotometer in a molecular biology laboratory is for the quantification of nucleic acids. Whether preparing DNA for a PCR reaction, RNA for a Northern blot, or oligonucleotides for gene synthesis, knowing the precise concentration and purity of the sample is the first and most critical step.
2.1 The 260 nm Wavelength: DNA and RNA’s Unique Signature
The ability to quantify nucleic acids with UV spectrophotometry stems from the chemical structure of their building blocks. The nitrogenous bases—adenine (A), guanine (G), cytosine (C), thymine (T), and uracil (U)—are all aromatic ring structures. These rings contain a system of delocalized pi electrons that readily absorb ultraviolet light. This absorption is maximal at a wavelength of approximately 260 nm. This distinct absorption peak serves as a unique spectroscopic “fingerprint,” making 260 nm the universal standard wavelength for quantifying DNA and RNA.
2.2 From Absorbance to Concentration: The Magic Numbers
By leveraging the Beer-Lambert law (A=ϵlc), we can easily determine the concentration of a nucleic acid sample. Since the path length (l) is standardized to 1 cm and the molar absorptivity (ϵ) has been empirically determined for different types of nucleic acids, the equation can be simplified. For a standard 1 cm path length, a measured absorbance of 1.0 at 260 nm (A260) corresponds to a well-established concentration of nucleic acid. These established conversion factors are the “magic numbers” used in labs worldwide.
Table 2: Standard Conversion Factors for Nucleic Acid Quantification (at A260)
| Nucleic Acid Type | Concentration for A260=1.0 (in µg/mL) | Common Abbreviation |
| Double-stranded DNA | 50 µg/mL | dsDNA |
| Single-stranded DNA | 33 µg/mL | ssDNA |
| Single-stranded RNA | 40 µg/mL | ssRNA |
| Short single-stranded Oligonucleotides | ~20–33 µg/mL | Oligos |
Data sourced from the concentration for oligonucleotides varies based on base composition.
To calculate the concentration of an unknown sample, one simply measures its absorbance at 260 nm and applies the following formula:
Concentration (µg/mL)=A260×Conversion Factor×Dilution Factor
For example, if a sample of dsDNA is diluted 10-fold and gives an A260 reading of 0.25, its original concentration would be calculated as: 0.25×50 µg/mL×10=125 µg/mL.
2.3 Assessing Purity: The Critical A260/A280 and A260/A230 Ratios
A concentration value is meaningless without an assessment of sample purity. A mantra in molecular biology is “garbage in, garbage out.” If a DNA sample is contaminated, the A260 reading will be artificially inflated, leading to a gross overestimation of the actual DNA concentration. This can cause downstream experiments like PCR or DNA sequencing to fail due to incorrect amounts of template DNA being added. Spectrophotometry provides two critical ratios to diagnose the most common types of contamination.
The A260/A280 Ratio: The Protein Check
Proteins are a common contaminant in nucleic acid preparations. The aromatic amino acids tryptophan and tyrosine, found in most proteins, have a strong UV absorbance peak at 280 nm. By measuring the absorbance at both 260 nm and 280 nm, the ratio of these two values (A260/A280) provides a rapid assessment of protein contamination.
- For pure dsDNA, the expected A260/A280 ratio is ~1.8 to 1.9.
- For pure RNA, the expected A260/A280 ratio is ~2.0 to 2.1.
A ratio significantly lower than these values indicates the presence of contaminating protein or residual phenol from the extraction process, both of which absorb strongly at 280 nm.
The A260/A230 Ratio: The Organic & Salt Check
The A260/A230 ratio serves as a secondary, but equally important, measure of purity. Many common laboratory reagents used in nucleic acid purification kits absorb light at or near 230 nm. These include chaotropic salts like guanidine thiocyanate and guanidine hydrochloride, phenol, TRIzol, EDTA, and carbohydrates carried over from the source material.
- For a pure nucleic acid sample (both DNA and RNA), the expected A260/A230 ratio should be greater than 2.0, often falling in the range of 2.0–2.4.
A low A260/A230 ratio is a strong red flag, indicating that the sample is likely contaminated with residual salts or organic solvents from the purification process. Such contaminants can inhibit enzymatic reactions in downstream applications.
Correcting for “Noise”: The Role of A320 in Measuring Turbidity
A final quality check involves measuring absorbance at 320 nm (A320). Neither nucleic acids nor common chemical contaminants absorb light in this region. Therefore, any absorbance reading at 320 nm is typically due to light scattering caused by particulates in the solution, such as cell debris, insoluble particles, or residual magnetic beads from a purification kit. It is a measure of the sample’s turbidity, or “dirtiness”. A clean, pure sample should have an A320 value very close to zero.
Table 3: Interpreting Nucleic Acid Purity Ratios
| Ratio | Ideal Value (DNA) | Ideal Value (RNA) | Low Ratio Indicates… | High Ratio Indicates… |
| A260/A280 | ~1.8 – 1.9 | ~2.0 – 2.1 | Protein or phenol contamination. | Generally not an issue; may indicate RNA contamination in a DNA prep. |
| A260/A230 | > 2.0 | > 2.0 | Contamination with salts (guanidine), organic solvents (phenol, ethanol), or carbohydrates. | May indicate an error in blanking or use of an inappropriate blank solution. |
2.4 When Ratios Lie: A Deeper Look at Contaminants and Confounding Factors
While the purity ratios are powerful diagnostic tools, they are not infallible and must be interpreted with caution and in context. Several factors can mislead the user, and a deeper understanding of these is the mark of an expert user.
First, the reliability of purity ratios is highly dependent on sample concentration. For dilute samples (generally below 20 ng/µL), the absorbance values at 230 nm and 280 nm are extremely low, often approaching the instrument’s detection limit or “noise floor.” In this situation, even a tiny amount of background absorbance from the buffer or minor instrument drift can have a disproportionately large effect on the calculated ratio, rendering it highly variable and unreliable. Therefore, purity ratios from very dilute samples should be viewed with extreme skepticism.
Second, the pH of the buffer used to dissolve the nucleic acid has a dramatic impact on the A260/A280 ratio. The protonation state of the nucleotide bases changes with pH, which in turn alters their UV absorption profile. Measuring a pure DNA sample in an acidic solution (or unbuffered water, which can be slightly acidic due to dissolved CO2) can lower the A260/A280 ratio by as much as 0.2-0.3 units, making a perfectly pure sample appear contaminated. For this reason, it is best practice to always perform measurements in a stable, low-salt buffer with a slightly basic pH, such as TE buffer (Tris-EDTA, pH 8.0), and to use the exact same buffer for the blank measurement.
Finally, a holistic view of the entire spectrum provides more information than the ratios alone. A single contaminant often leaves a characteristic “fingerprint” across multiple wavelengths. For example, significant protein contamination not only lowers the A260/A280 ratio but also strongly reduces the A260/A230 ratio, because the peptide bonds in proteins absorb strongly in the 220-230 nm range. Similarly, contamination with phenol not only lowers the A260/A280 ratio but also characteristically shifts the absorbance peak from 260 nm towards 270 nm. Examining the full spectrum can thus help pinpoint the specific nature of a contamination issue.
Table 4: Common Contaminants in Nucleic Acid Preps and Their Spectroscopic Signatures
| Contaminant | Effect on A260/A280 | Effect on A260/A230 | Other Spectral Clues |
| Protein | Slightly to moderately reduced | Strongly reduced | Broad absorbance around 230 nm. |
| Phenol | Reduced | Reduced | Peak shifts towards 270 nm. |
| Guanidine Salts | Slightly reduced | Strongly reduced | Strong absorbance peak at ~230 nm. |
| EDTA | Unchanged | Decreased | Effect is more pronounced at low nucleic acid concentrations. |
| Ethanol | Unchanged | Slightly reduced | Not easily distinguished in the spectrum. |
| Polysaccharides | Unchanged | Reduced | Can increase background scattering (elevated A320). |
Part 3: Quantifying Proteins – Measuring the Molecules of Life
Alongside nucleic acids, proteins are the other major class of biomolecules routinely quantified by spectrophotometry. The methods for protein quantification are more varied, each with distinct advantages, disadvantages, and critical limitations that the user must understand to select the appropriate technique.
3.1 The Direct Approach: UV Absorbance at 280 nm (A280)
The simplest method for quantifying protein is to directly measure its absorbance in the UV range. This method relies on the fact that the aromatic amino acids, specifically tryptophan (Trp) and tyrosine (Tyr), contain ring structures that absorb UV light with a maximum peak at approximately 280 nm.
The advantages of the A280 method are compelling: it is extremely fast, requires no additional reagents, and is non-destructive, meaning the sample can be recovered and used after measurement. However, its limitations are significant and strict.
First, the method is only suitable for pure protein samples. Any contaminating substance that also absorbs at 280 nm, most notably nucleic acids (which have a significant absorbance shoulder at 280 nm), will interfere with the reading and lead to an overestimation of protein concentration. Second, the method has relatively low sensitivity and requires a fairly high protein concentration, typically above 0.1 mg/mL, to generate a reliable signal.28 Finally, and most critically, the accuracy of the A280 method depends on knowing the protein’s specific extinction coefficient (ϵ). This value is highly dependent on the protein’s unique amino acid composition—specifically, its number of tryptophan and tyrosine residues. Using a generic formula, like the Warburg formula, provides only a rough estimate, as the extinction coefficient can vary dramatically from one protein to another.
3.2 The Colorimetric Revolution: When Direct Measurement Isn’t Enough
For complex protein mixtures, such as crude cell lysates, or when the protein concentration is low, the direct A280 method is unsuitable. In these cases, researchers turn to colorimetric assays. These are chemical reactions that produce a colored product in the presence of protein. The intensity of the resulting color, which is measured by the spectrophotometer in the visible light range (e.g., at 562 nm or 595 nm), is proportional to the concentration of protein in the sample.
The primary advantage of colorimetric assays is that they are generally more sensitive than the A280 method and are far less susceptible to interference from non-protein components that might be in the sample buffer. However, they all share one critical requirement: they necessitate the creation of a standard curve. This involves assaying a series of samples containing a known concentration of a standard protein (such as bovine serum albumin, BSA) alongside the unknown samples. The concentration of the unknown is then determined by comparing its absorbance to this standard curve.
3.3 A Deep Dive into Colorimetric Assays: A Comparative Analysis
Several colorimetric assays are available, but the choice between them is not arbitrary. The selection of the most appropriate assay is almost always dictated by the chemical composition of the buffer in which the protein sample is dissolved. Certain buffer components are incompatible with specific assay chemistries, making this the most critical decision-making factor for any researcher.
The Bradford Assay
- Principle: The Bradford assay is based on the binding of a dye, Coomassie Brilliant Blue G-250, to proteins. In its unbound, acidic state, the dye is reddish-brown and has an absorbance maximum at 465 nm. When it binds to protein, primarily through interactions with basic (e.g., arginine) and aromatic amino acid residues, the dye is stabilized in its blue form, causing the absorbance maximum to shift to 595 nm.28 The increase in absorbance at 595 nm is proportional to the amount of protein.
- Key Advantage: Its chemistry is largely unaffected by the presence of reducing agents like dithiothreitol (DTT) and β-mercaptoethanol, which are very common in protein buffers to prevent oxidation and maintain protein structure.
- Key Disadvantage: The assay is highly incompatible with detergents such as sodium dodecyl sulfate (SDS) and Triton X-100. These chemicals interfere with the dye-protein interaction, leading to inaccurate results.
The BCA (Bicinchoninic Acid) Assay
- Principle: The BCA assay is a copper-based method that involves two sequential reactions. First, under alkaline conditions, the peptide bonds in the protein chelate cupric ions (Cu2+) and reduce them to cuprous ions (Cu+). This is known as the biuret reaction. Second, two molecules of bicinchoninic acid (BCA) specifically chelate with one cuprous ion (Cu+), forming an intensely purple-colored complex that exhibits a strong absorbance maximum at 562 nm.
- Key Advantage: The BCA assay is compatible with a wide range of detergents (often up to 5% concentration), making it the method of choice for samples solubilized from cell membranes or prepared in detergent-containing lysis buffers. It also exhibits less protein-to-protein variability compared to the Bradford assay because the reaction involves the peptide backbone, which is common to all proteins.
- Key Disadvantage: The assay chemistry is based on the reduction of copper, so it is highly incompatible with reducing agents (like DTT) and copper-chelating agents (like EDTA), which directly interfere with the reaction and lead to a gross overestimation of protein concentration.
The Lowry Assay
- Principle: The Lowry assay is another two-step, copper-based method, historically very important in biochemistry. Like the BCA assay, it begins with the reaction of protein with copper in an alkaline solution. However, the second step involves the reduction of the Folin-Ciocalteu reagent by the copper-treated protein, which produces a blue-colored complex.
- Historical Context: For many years, the Lowry paper was one of the most cited in all of scientific literature. However, the method is more complex to perform, its reagents are less stable, and it is prone to interference from a wider range of substances than the BCA assay. For these reasons, it has been largely superseded in modern laboratories by the more robust and convenient BCA method.
Table 5: A Head-to-Head Comparison of Common Protein Quantification Assays
| Assay Method | Principle | Wavelength (nm) | Compatible With… | Incompatible With… | Pros | Cons |
| UV A280 | Direct UV absorbance by aromatic amino acids | 280 | Most buffers | Nucleic acids, other UV-absorbing compounds | Very fast, non-destructive, no reagents | Low sensitivity, requires pure protein, high protein-to-protein variability |
| Bradford | Coomassie dye-binding | 595 | Reducing agents (DTT), most salts | Detergents (SDS, Triton X-100), basic buffers | Fast, simple, high sensitivity | High protein-to-protein variability, detergent incompatibility |
| BCA | Copper reduction and chelation by BCA | 562 | Detergents (up to 5%), most buffers | Reducing agents (DTT), chelators (EDTA) | Low protein-to-protein variability, detergent compatible | Slower (requires incubation), reducing agent incompatibility |
| Lowry | Copper reduction and Folin reagent | 650-750 | Detergents | Reducing agents, chelators, many other substances | High sensitivity | Complex procedure, many interferences, largely superseded by BCA |
3.4 The Art of the Standard Curve: A Step-by-Step Guide
For any colorimetric assay, the absorbance value of an unknown sample is meaningless in isolation. Its concentration can only be determined by comparing its absorbance to a standard curve generated from a series of samples with known concentrations. Creating an accurate standard curve is a non-negotiable step for reliable quantification.
The process is straightforward but requires precision:
- Prepare a Stock Solution: Begin with a high-quality, accurately known concentration of a standard protein. A common choice is bovine serum albumin (BSA) at a concentration of 2 mg/mL.
- Create Serial Dilutions: From this stock solution, prepare a series of dilutions to create at least 5-7 standards with known, decreasing concentrations that span the expected range of your unknown samples. The buffer used for dilution should be the same as the buffer your unknown samples are in.
- Assay Standards and Unknowns: It is critical to process all standards and unknown samples at the same time and under identical conditions. Add the assay reagent to all tubes, mix, and incubate for the specified time and at the specified temperature.
- Measure Absorbance: After incubation, measure the absorbance of all standards and unknowns at the appropriate wavelength for the chosen assay (e.g., 595 nm for Bradford, 562 nm for BCA). Remember to first “blank” the spectrophotometer using a sample that contains only the buffer and the assay reagent, with no protein.
- Plot the Data: Using software like Microsoft Excel, create a scatter plot. The known concentrations of the standards should be on the X-axis (the independent variable), and their corresponding blank-corrected absorbance values should be on the Y-axis (the dependent variable).
- Generate a Trendline and Equation: Fit a trendline to the data points of the standards. For most assays in their linear range, a linear regression is appropriate. For assays with a broader, non-linear range, a second-order polynomial (or other curve fit) may be more accurate. Display the equation of the line (e.g., y=mx+c) and the coefficient of determination (R2) on the chart. The
R2 value is a measure of how well the line fits the data; a value of 0.99 or higher indicates a very good fit. - Calculate Unknown Concentration: With the equation of the line, you can now determine the concentration of your unknown sample. Substitute the measured absorbance of your unknown sample for ‘y’ in the equation and solve for ‘x’ (concentration). If your unknown sample was diluted prior to the assay, remember to multiply this calculated concentration by the dilution factor to find the concentration of your original, undiluted sample.
3.5 Choosing Your Standard: Why BSA Isn’t Always the Answer
A final, crucial consideration is the choice of the protein standard itself. This choice is a significant potential source of error and variability in protein quantification.
The underlying issue is that different proteins have different amino acid compositions. Since colorimetric assays like Bradford and BCA rely on reactions with specific amino acid residues (e.g., arginine for Bradford, cysteine/tryptophan for BCA), the amount of color produced per microgram of protein will vary from one protein to another. This means that if you use BSA as your standard, the concentration you calculate for your protein of interest is actually a “BSA-equivalent” concentration. It is an estimate relative to the standard, not an absolute value.
The gold-standard approach is to use a highly purified, known concentration of your actual protein of interest to generate the standard curve. This will provide the most accurate measurement. However, for many researchers, this is impractical, as a purified version of their protein may not be available or may be too precious or expensive to use as a standard.
Therefore, the most common and accepted practice is to use a readily available and inexpensive protein standard like Bovine Serum Albumin (BSA) or Bovine Gamma Globulin (BGG). The most important principle in this context is consistency. By always using the same protein standard for all related experiments, a researcher ensures that while the absolute concentration values may be estimates, the relative comparisons between different samples are valid and reproducible.
Part 4: Beyond Purity – Measuring Microbial Growth
In addition to quantifying purified molecules, spectrophotometers are essential tools in microbiology for monitoring the growth of cell cultures.
4.1 Tracking Life in a Test Tube: The OD600 Measurement
The standard method for estimating the density of a bacterial or yeast culture in liquid media is to measure its optical density (OD) at a wavelength of 600 nm, a measurement commonly referred to as OD600.
It is critical to understand that this is not a true absorbance measurement. The microbial cells are not dissolved in the solution; they are suspended particles. These particles are much larger than the wavelength of light being used, so instead of absorbing the light, they scatter it. As the light beam passes through the culture, the cells deflect the light in many directions. The spectrophotometer’s detector, positioned directly in the light path, measures a decrease in transmitted light because much of it has been scattered away and no longer reaches the detector. The wavelength of 600 nm is chosen because it is in the visible orange range and is not strongly absorbed by common components of microbial growth media (like yeast extract or tryptone), thus minimizing background interference.
4.2 From Optical Density to Cell Count: The Importance of Calibration
Because an OD600 measurement is based on light scattering, the linear relationship of the Beer-Lambert law does not strictly apply, especially as the culture becomes dense. At high cell densities, light that is scattered by one cell can be re-scattered by another cell back into the path of the detector, a phenomenon known as multiple scattering. This causes the relationship between OD600 and the actual cell density to become non-linear.
Therefore, to obtain an accurate cell count (e.g., in cells/mL or colony-forming units/mL), each laboratory must generate its own calibration curve that correlates OD600 readings to actual cell numbers for their specific microbial strain, growth conditions, and spectrophotometer. The geometry of the instrument’s optics (e.g., the distance from the sample to the detector) affects how much scattered light is captured, so an OD600 reading of 0.5 on one instrument may not correspond to the same cell density as a reading of 0.5 on a different model.
The calibration process involves:
- Growing a culture of the microorganism of interest.
- Periodically taking samples from the growing culture.
- For each sample, immediately measuring its OD600.
- For the exact same sample, performing a series of dilutions and plating them on agar plates. After incubation, the number of colonies is counted to determine the viable cell count, or colony-forming units per milliliter (CFU/mL).
- A graph is then plotted with the actual cell density (CFU/mL) on the X-axis and the corresponding OD600 measurement on the Y-axis. This growth curve can then be used in future experiments to quickly and reliably convert an OD600 reading into an estimated cell density for that specific strain and set of conditions.
Part 5: The Art of Accuracy – A Practical Guide to Flawless Spectrophotometry
The power of a spectrophotometer is matched only by its sensitivity to user error. Achieving accurate and reproducible results is not automatic; it is the result of careful technique and adherence to best practices.
5.1 Best Practices for Reliable Results
- Instrument Calibration and Maintenance: Instruments should be calibrated regularly according to the manufacturer’s recommendations, often using certified reference materials. The instrument should be allowed to warm up properly before use to ensure the lamp output is stable. Routine maintenance, such as cleaning the exterior and the sample compartment, is also essential.
- Cuvette Handling: Cuvettes are precision optical components and must be treated as such. Always use clean, unscratched cuvettes. For measurements in the UV range (below ~340 nm), quartz cuvettes are mandatory as plastic and glass absorb UV light. When handling a cuvette, only touch the frosted or ribbed sides; fingerprints on the clear optical surfaces will scatter and absorb light, causing erroneous readings. For maximum precision, always use the same cuvette for the blank and the sample, ensuring it is oriented in the same direction in the holder each time.
- Proper Blanking: The “blank” measurement is arguably the most critical step for accuracy. The purpose of the blank is to zero the instrument and subtract any absorbance that comes from the solvent or buffer itself, or from the cuvette. The blank solution must contain everything that the sample solution contains, except for the analyte of interest. For example, if your DNA is dissolved in TE buffer, the blank must be TE buffer from the same stock. Blanking with water when your sample is in a buffer is a common and serious error.
- Sample Preparation: Samples must be homogeneous and free of particulates or bubbles. Gently vortex or mix the sample immediately before taking a measurement to ensure there are no concentration gradients. If the sample is turbid, it should be centrifuged to pellet any debris before measurement. When pipetting into the cuvette, avoid introducing air bubbles, which will cause significant light scattering and wildly inaccurate readings.
- Optimal Absorbance Range: As dictated by the Beer-Lambert Law, measurements are only reliable within the instrument’s linear range. This is typically between 0.1 and 1.5 absorbance units. Samples that are too concentrated (A > 1.5) or too dilute (A < 0.1) will give unreliable results and must be diluted or concentrated accordingly.
- Microvolume Spectrophotometer Specifics: For instruments like the NanoDrop that use a 1-2 µL sample droplet, it is imperative to clean both the upper and lower measurement pedestals with a clean, dry, lint-free wipe before loading the blank and before and after every single sample measurement. Use a fresh pipette tip and a fresh aliquot of sample for every reading to avoid cross-contamination and evaporation effects.
5.2 A Comprehensive Troubleshooting Guide
Even with careful technique, problems can arise. The following table provides a guide to diagnosing and solving the most common issues encountered during spectrophotometry.
Table 6: A Comprehensive Troubleshooting Guide for Common Spectrophotometry Issues
| Symptom / Problem | Possible Causes | Recommended Solutions |
| Unstable or Drifting Readings | 1. Instrument lamp has not warmed up sufficiently.
2. Sample is too concentrated (outside linear range). 3. Sample is not mixed; concentration is changing in the light path. 4. Dirty or contaminated cuvette/pedestal. 5. Air bubbles in the sample. |
1. Allow the instrument to warm up for at least 15-30 minutes.
2. Dilute the sample to bring absorbance into the 0.1-1.5 range. 3. Gently vortex the sample before measurement. 4. Thoroughly clean the cuvette or pedestal surfaces. 5. Remove the cuvette, tap gently to dislodge bubbles, and re-measure. Re-pipette if necessary. |
| Negative Absorbance Readings | 1. The blank solution was “dirtier” or more absorbent than the sample.
2. The cuvette/pedestal was dirty during the blank measurement and clean during the sample measurement. 3. The blank and sample were measured in different, mismatched cuvettes. |
1. Ensure the blank is the exact same buffer/solvent as the sample.
2. Re-clean the cuvette/pedestal, re-blank the instrument, and re-measure the sample. 3. Use the exact same cuvette for both blank and sample measurements. |
| Unexpected Peaks in Spectrum | 1. Contamination in the sample or the buffer.
2. Dirty or scratched cuvette. 3. Using the wrong type of cuvette (e.g., plastic for UV measurements). |
1. Prepare a fresh sample or use a new batch of buffer.
2. Clean the cuvette thoroughly or use a new, unscratched one. 3. Use a quartz cuvette for any measurements below 340 nm. |
| Nucleic Acid A260/A280 Ratio is Low (<1.7) | 1. Protein contamination.
2. Residual phenol contamination. 3. Measured in water or an acidic buffer. 4. Sample concentration is too low (<20 ng/µL), making the ratio unreliable. |
1. Re-purify the sample (e.g., perform an additional cleanup step).
2. Perform an ethanol precipitation or column cleanup to remove phenol. 3. Re-suspend the sample in a buffered solution (e.g., TE, pH 8.0) and re-measure. 4. Concentrate the sample or use a more sensitive quantification method (e.g., fluorescence). |
| Nucleic Acid A260/A230 Ratio is Low (<2.0) | 1. Contamination with guanidine salts from the purification kit.
2. Contamination with carbohydrates, phenol, or other organic compounds. 3. Blanking with an incorrect buffer (e.g., blanking with water for a sample in TE). |
1. Ensure the column wash steps were performed correctly; re-purify if necessary.
2. Re-purify the sample using a different method or additional cleanup steps. 3. Re-blank with the correct buffer and re-measure the sample. |
| No Reading / Instrument Error | 1. Lamp has burned out or is failing.
2. Instrument is not properly connected to the computer. 3. Software issue or incorrect settings. |
1. Check the lamp status in the instrument software; the lamp may need replacement.
2. Check all cable connections. 3. Restart the software and/or the instrument. Consult the user manual for specific error codes. |
Conclusion: The Enduring Power of a Simple Beam of Light
The spectrophotometer stands as a testament to the power of fundamental physical principles applied to biological questions. Its remarkable versatility allows it to quantify the very building blocks of life—DNA, RNA, and proteins—and even to track the growth of living organisms, all through the elegant and non-invasive measurement of a simple beam of light. From providing a quick concentration check that takes mere seconds to enabling complex kinetic studies that unfold over hours, its role in the modern life sciences laboratory is both foundational and indispensable.
However, this guide has underscored a critical truth: the accuracy of a spectrophotometer is not automatic. It is a direct result of the user’s comprehension of the underlying theory, a keen awareness of the potential pitfalls and sources of error, and a disciplined adherence to meticulous laboratory practice. By understanding the journey of light through the instrument, the meaning behind the purity ratios, the crucial differences between protein assays, and the nuances of measuring light scattering versus absorbance, a researcher transforms the spectrophotometer from a simple machine into a powerful analytical partner. In mastering this essential tool, we ensure the integrity of our data and, by extension, the validity of the countless discoveries it helps to enable.
To purchase HINOTEK spectrophotometers, please refer to our catalog.
For inquiries or purchasing needs, please contact the HINOTEK team: [email protected]
This guide is maintained by HINOTEK’s core technical team, comprised of senior engineers and application scientists with over two decades of hands-on experience in fields such as microscopy, centrifugation, and spectrophotometry. We are committed to ensuring that every piece of information in this guide—from instrument principles and technical specifications to laboratory procurement advice—maintains the highest level of accuracy and timeliness.
This content is regularly reviewed and updated to reflect the latest industry standards and technological advancements. We value feedback from the global scientific community. Should you have any questions or suggestions, or wish to discuss any technical details, please do not hesitate to contact our expert team at [email protected].