Colorimeter vs. Spectrophotometer: A Technical Comparison of Analytical Instruments
In scientific research and industrial quality control, accurate measurement of light and color is critical. HINOTEK offers both Colorimeters (View Here) and Spectrophotometers (View Here) as core instruments. While these two instruments are often used interchangeably and sometimes easily confused, they operate on fundamentally different principles and address distinct analytical challenges. Below, I’ll explain their key differences from a professional perspective.
 |
 |
A colorimeter is designed to quantify color in a way that mimics human perception, providing a rapid, objective assessment of how a color appears. In contrast, a spectrophotometer performs a more profound analysis, measuring the intrinsic physical properties of a sample by quantifying its interaction with light across a full spectrum of wavelengths. This report provides an exhaustive technical comparison of these two instruments, examining their foundational principles, internal architecture, functional capabilities, and practical applications to provide a clear framework for selecting the appropriate tool for a given analytical challenge.
Foundational Principles of Light and Matter Interaction
To understand the differences between a colorimeter and a spectrophotometer, it is essential to first grasp the distinct scientific models that govern their operation. Their designs are not arbitrary; they are the physical embodiments of two different ways of interpreting the interaction between light and matter.
The Language of Measurement: Spectroscopy and Spectrometry
The terms “spectroscopy” and “spectrometry” are often used interchangeably, but they have precise definitions according to the International Union of Pure and Applied Chemistry (IUPAC). Spectroscopy is the theoretical study of the interaction between electromagnetic radiation (like light) and matter. It is the broad field of science concerned with how materials absorb, emit, or scatter energy.
Spectrometry, on the other hand, is the practical application of spectroscopy; it is the measurement of the resulting spectra to obtain quantifiable, numerical data about a system. A spectrophotometer, therefore, is an instrument used to perform spectrometry. This distinction highlights the quantitative, data-driven nature of these measurements.
The Principle of Color Perception: The Tristimulus Model (The Colorimeter’s Foundation)
A colorimeter is fundamentally an instrument of psychophysics, designed to quantify a subjective human experience: color perception. Its operation is based on the tristimulus theory of color vision, which posits that the human eye perceives color through three different types of cone photoreceptors in the retina. Each type is sensitive to a broad region of the visible spectrum, roughly corresponding to red, green, and blue light.
A tristimulus colorimeter is engineered to mimic this biological process. It illuminates a sample with a standardized light source and measures the reflected or transmitted light using a set of three wideband filters—typically Red, Green, and Blue (RGB). These filters do not isolate single, narrow wavelengths but instead capture broad regions of the spectrum, analogous to the response curves of the eye’s cone cells. The instrument’s detector measures the intensity of light passing through each of these three filters, generating three numerical values. These values, known as tristimulus values (e.g., X, Y, Z), can then be mathematically converted into coordinates within a device-independent color space,
most commonly the CIE L*a*b* space. In this space:
- represents lightness, on a scale from 0 (perfect black) to 100 (perfect white).
- represents the red-green axis, where positive values indicate redness and negative values indicate greenness.
- represents the yellow-blue axis, where positive values indicate yellowness and negative values indicate blueness.
The purpose of a colorimeter is therefore not to analyze the full physical properties of the light itself, but to provide a single, objective, and repeatable numerical answer to the question, “What color is this to a standard human observer under a specific light source?”.
The Principle of Quantitative Analysis: The Beer-Lambert Law (The Spectrophotometer’s Foundation)
In contrast to the colorimeter, the spectrophotometer is an instrument of physical chemistry, designed to measure a fundamental physical property of a sample: its spectral absorbance or transmittance. For quantitative analysis of solutions, its operation is governed by the Beer-Lambert Law. This law establishes a linear relationship between the amount of light absorbed by a solution and the concentration of the light-absorbing substance (analyte) within it.The mathematical expression of the Beer-Lambert Law is:
Where:
- is absorbance (a unitless quantity).
- (epsilon) is the molar absorptivity or molar extinction coefficient, a constant that is unique to a specific chemical substance at a specific wavelength of light.
- is the path length of the light beam through the sample, typically the width of the sample holder (cuvette).
- is the concentration of the analyte in the solution.
By precisely measuring the absorbance () of a sample at a specific, isolated wavelength where the analyte absorbs strongly, a spectrophotometer allows for the accurate determination of an unknown concentration (), provided that and are known. This capability moves far beyond simple color perception and into the realm of quantitative chemical analysis, enabling applications like determining the concentration of DNA in a solution or monitoring the progress of an enzymatic reaction.
The foundational principles of these two instruments reveal a fundamental dichotomy in their scientific approach. The colorimeter’s data is a model of perception, while the spectrophotometer’s data is a measure of physical reality. This distinction is the ultimate cause of all other functional differences between them.
Instrument Architecture: An Inside Look at Core Components
The functional differences between a colorimeter and a spectrophotometer originate directly from their internal architecture. The choice of optical components, particularly the mechanism for wavelength selection, dictates the type of data each instrument can produce and, consequently, its range of applications.
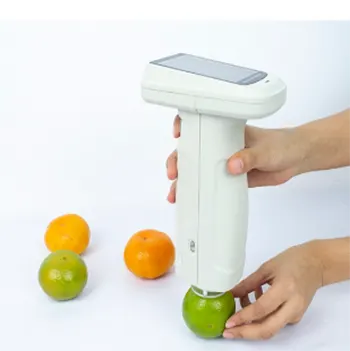
The Colorimeter: An Electronic Eye
A colorimeter’s design is relatively simple, mirroring its function of simulating human vision. The light path consists of three primary stages:
- Light Source: A standardized, stable light source, such as a tungsten or LED lamp, provides consistent illumination of the sample.
- Wavelength Selection: The reflected or transmitted light from the sample passes through a set of three wideband glass filters: Red, Green, and Blue (RGB). These filters are the core of the instrument’s design. Their purpose is not to isolate discrete wavelengths but to integrate light over broad spectral regions that correspond to the sensitivities of the human eye’s cone cells. In some designs, a single detector is used in conjunction with a rotating wheel that places each filter in the light path sequentially.
- Detector and Output: A photodetector, typically a silicon photodiode, measures the total intensity of light that passes through each of the three filters. These three intensity readings are then computationally converted into a single set of tristimulus coordinates, such as CIE L*a*b*, which represents a single point in a color space.
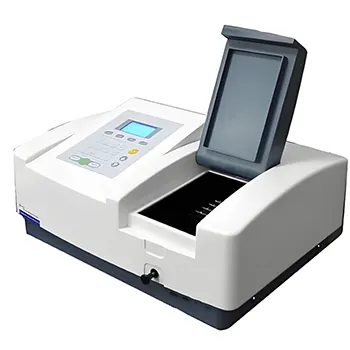
The Spectrophotometer: The Spectrum Unveiled
A spectrophotometer is a more complex and sophisticated instrument designed to resolve light into its component wavelengths with high precision. Its architecture includes several key components:
- Light Source: A broadband light source is used to cover a wide spectral range. This is often a combination of a deuterium arc lamp for the ultraviolet (UV) region and a tungsten-halogen lamp for the visible and near-infrared (NIR) regions, or a single xenon arc lamp that covers the entire range.
- Monochromator: This is the heart of the spectrophotometer. Light from the source passes through an entrance slit to create a well-defined beam. This beam is then directed to a dispersive element, which in modern instruments is a diffraction grating. A diffraction grating is an optical surface precisely etched with thousands of parallel grooves per millimeter. When light strikes the grating, it is diffracted and dispersed, separating the polychromatic beam into its constituent wavelengths. Compared to a prism, a grating provides more uniform dispersion across the spectrum and is the standard for high-performance instruments. By either rotating the grating or using a fixed grating coupled with a detector array, the instrument can measure light intensity at very narrow, discrete intervals (e.g., every 1 nm, 5 nm, or 10 nm).
- Detector and Output: The detector must be highly sensitive to measure the low light levels at each narrow wavelength band. Common detectors include Photomultiplier Tubes (PMTs), which are extremely sensitive and used in scanning instruments, or solid-state detector arrays like Charge-Coupled Devices (CCDs), which can capture the entire spectrum simultaneously. The output is not a single point but a spectral data curve—a graph that plots reflectance, transmittance, or absorbance as a function of wavelength. This curve serves as a unique “fingerprint” for the sample.
Architectural Refinement: Single-Beam vs. Double-Beam
Spectrophotometers are further classified by their beam path architecture:
- Single-Beam Spectrophotometer: In this simpler and more cost-effective design, the entire light beam passes through the sample holder. To make a measurement, the operator must first measure a “blank” (the solvent and cuvette alone) to establish a 100% transmittance baseline. The sample is then measured, and its absorbance is calculated relative to that baseline. This design is susceptible to errors from fluctuations in the light source’s intensity over time.
- Double-Beam Spectrophotometer: This more advanced design enhances stability and accuracy. The light beam from the monochromator is split into two separate paths using a beam splitter or a rotating chopper wheel. One beam passes through the sample, while the other simultaneously passes through a reference (blank). The instrument’s detectors measure the ratio of the two beams, automatically compensating in real-time for any fluctuations in the lamp’s output. This results in more stable and reliable measurements, especially for long-duration experiments like reaction kinetics.
The architectural divergence between broad filters and a precise diffraction grating is the direct cause of the profound functional differences between the two instruments. The colorimeter’s design inherently discards detailed spectral information in favor of a perception-based summary, while the spectrophotometer’s design preserves this detail, enabling a far deeper level of analysis.
The architectural differences between colorimeters and spectrophotometers lead to a critical divide in their capabilities, particularly concerning accuracy and the ability to detect the industrial challenge of metamerism.
The Phenomenon of Metamerism
Metamerism is a phenomenon where two colored objects appear to be a perfect match under one lighting condition but fail to match when the lighting changes. This occurs because the objects have different spectral reflectance curves (different “fingerprints”) that happen to stimulate the three cone types in the human eye in the same way under the first light source. However, when the spectral composition of the light source changes (e.g., moving from fluorescent office lighting to natural daylight), the different fingerprints interact with the new light differently, resulting in a perceived color mismatch. Metamerism is a significant risk in manufacturing, where components produced with different pigments or materials must match seamlessly across various environments—for example, the plastic dashboard, leather seats, and painted trim of a car interior.
Why Colorimeters Are “Metamerism-Blind”
A tristimulus colorimeter is inherently incapable of detecting metamerism. Its filter-based design measures color by simulating human perception under a single, fixed illuminant—the one built into the device. When measuring two metameric samples, the colorimeter will produce identical (or nearly identical) L*a*b* values, correctly reporting that they are a match under its specific measurement conditions. However, because it discards the underlying spectral data, it has no information about the samples’ fingerprints. It is therefore “blind” to the fact that their spectral curves are different and cannot predict that the match will fail under a different light source. The colorimeter provides a correct answer to a very limited question, making it unreliable for applications where color consistency across different lighting is critical.
The Spectrophotometer’s Definitive Advantage: Unmasking Metamers
The spectrophotometer’s ability to measure a sample’s complete spectral reflectance curve gives it the definitive advantage in managing metamerism. Because the instrument captures the full color fingerprint, its software can use this data to perform powerful calculations. By mathematically combining the sample’s measured spectral curve with the standardized spectral power distribution data of any illuminant (e.g., CIE Illuminant D65 for daylight, Illuminant A for incandescent light, or F2 for cool white fluorescent light), the spectrophotometer can accurately predict the sample’s L*a*b* color values under that specific condition.
This allows an operator to compare two samples not just under one light source, but under a dozen. The software can flag a metameric pair by showing that while their L*a*b* values are a match under D65, they diverge significantly under F2. This predictive power is essential for color formulation and quality control in global supply chains, preventing costly production errors and product rejections. The colorimeter provides a static verdict on color, whereas the spectrophotometer provides the dynamic evidence needed to reach a verdict under any condition.
A Comparative Analysis of Accuracy, Resolution, and Cost
The functional differences are also reflected in accuracy, resolution, and cost:
- Accuracy and Resolution: Spectrophotometers offer vastly superior accuracy and resolution. They measure reflectance at 31 or more narrow bands across the visible spectrum, while a colorimeter measures only three very broad bands. This high-fidelity data is what enables complex color analysis, formulation, and the detection of subtle color differences that a colorimeter would miss.
- Cost: The difference in optical complexity and analytical power translates directly to cost. Colorimeters are generally a more economical option, suitable for applications where the risks of metamerism are low and the primary need is simple color comparison. Spectrophotometers represent a significantly higher capital investment, with prices ranging from a few thousand dollars for basic single-beam models to tens of thousands for high-end, double-beam, multi-angle instruments. This higher cost should be viewed as an investment in data quality and risk mitigation.
The choice between a colorimeter and a spectrophotometer is ultimately dictated by the specific task. Their applications fall into two broad categories: colorimeters are primarily used for control, while spectrophotometers are used for analysis and formulation.
Colorimeter Applications: When Speed and Simplicity Prevail
The colorimeter excels in applications where speed, portability, and cost-effectiveness are paramount, and the materials and lighting are well-controlled.
- Quality Control in Printing and Plastics: In a production environment, colorimeters are widely used for routine batch-to-batch quality control. For example, a printer can use a handheld colorimeter to quickly check if the color of a printed sheet matches the approved standard. Since the inks and paper substrate are consistent, the risk of metamerism is low, making the colorimeter a fast and efficient tool for process control.
- Digital Imaging and Graphic Design: Colorimeters are essential tools for calibrating computer monitors and printers. The device measures the color output of a monitor and works with software to create a custom ICC profile. This ensures that the colors viewed on-screen are accurate and that the final printed output will match the designer’s intent, a process known as color management.
- Simple Field Analysis: Portable, battery-powered colorimeters are used for basic analysis outside the lab. In agriculture, they can assess fruit ripeness based on skin color. In environmental monitoring, they can measure water quality by quantifying the color change of a sample after a reagent is added.
Spectrophotometer Applications: Where Precision is Paramount
The spectrophotometer is the indispensable tool for applications requiring high-precision data, chemical analysis, and color formulation.
- Chemical & Quantitative Analysis
- Solution concentration measurement: One of the most common uses of a spectrophotometer. By measuring light absorption at specific wavelengths, it determines solute concentrations—e.g., nucleic acids, proteins, and enzymes in labs.
- Material characterization: Analyzes absorbance, transmittance, and reflectance to evaluate optical properties, such as UV-blocking in sunglasses or light-reflecting traits in cosmetics.
- Qualitative analysis: Identifies substances by analyzing absorption spectra (e.g., unknown compound structures).
- Scientific Research
- Biochemistry: Enzyme kinetics, protein interactions, cell growth monitoring.
- Materials science: Optical/surface properties of materials.
- Environmental science: Water/air quality assessment.
- Industrial Applications
- Quality control: Ensures consistency in food, beverages, pharmaceuticals, and cosmetics.
- Color measurement: Precision color matching for paints, plastics, textiles.
- Process control: Real-time monitoring of chemical reactions.
- Medical & Pharmaceutical
- Drug analysis: Quality testing, metabolism studies.
- Clinical diagnostics: Measures biomarkers like hemoglobin levels.
- Food & Beverage
- Ingredient analysis: Quantifies proteins, fats, sugars.
- Colorant testing: Verifies dye concentrations and hues.
- Environmental Monitoring
- Water testing: Detects heavy metals, organic pollutants.
- Air quality: Tracks SO₂, NOx emissions.
- Fluorescence Spectrophotometry
- Scans fluorescence spectra of liquids/solids for research and clinical testing.
- Atomic Absorption Spectrophotometry
- Measures trace metal content for microanalysis and QC.
Obtaining reliable and repeatable data from a colorimeter or spectrophotometer depends as much on disciplined operator procedure as it does on the instrument’s specifications. While these are precision instruments, the single largest source of error is often procedural inconsistency. Adherence to a standardized methodology is paramount.
The Foundation of Accuracy: Instrument Calibration
Calibration is a non-negotiable first step that sets the baseline for all subsequent measurements.
- Warm-up: All instruments require a warm-up period after being turned on, typically ranging from 5 to 30 minutes. This allows the light source and detector electronics to reach thermal stability, preventing drift during measurements.
- Calibration for Transmittance/Absorbance: For liquid samples, a two-step calibration is standard. First, a 0% Transmittance (or 100% Absorbance) measurement is taken with the instrument’s light path blocked. This establishes the “dark” reading, or electronic zero point. Second, a 100% Transmittance (or 0 Absorbance) measurement is performed using a “blank”—a cuvette filled with the pure solvent used to prepare the samples. This critical step subtracts any absorbance from the solvent and the cuvette itself, ensuring that the final measurement reflects only the properties of the analyte. This blanking procedure must be repeated every time the measurement wavelength is changed on a scanning instrument.
- Calibration for Reflectance: For measuring opaque surfaces, calibration is performed using standardized, certified tiles. The operator measures a highly absorbent “black trap” or black glass to set the zero point and a highly reflective, calibrated white tile to set the 100% point.
The Science of Sample Handling
The sample itself must be prepared with care to ensure the measurement is representative and free of artifacts.
- Homogeneity: Liquid samples must be well-mixed and free of air bubbles, which can scatter light and cause erroneously high absorbance readings. Solid samples should have a uniform, clean surface.
- Consistency: To ensure results are comparable, all samples within an experiment, including the blank, must be prepared using identical procedures, dilutions, and equipment.
The Cuvette: A Critical Optical Component
The sample holder, or cuvette, is not merely a container; it is a precision optical component in the light path. Mishandling it is a primary cause of inaccurate results.
- Material Selection: The cuvette material must be transparent at the measurement wavelengths. Standard glass or plastic cuvettes are suitable for the visible range (approximately 340-900 nm). For measurements in the UV range (below 340 nm), quartz cuvettes are mandatory, as glass and plastic absorb UV light and will render the results meaningless.
- Handling: Always handle cuvettes by their frosted or ribbed sides. Never touch the clear optical windows. Fingerprints contain oils and residues that absorb and scatter light, which can dramatically alter readings. The use of powder-free gloves is best practice.
- Cleaning: Cuvettes must be scrupulously clean. After use, rinse them multiple times with the appropriate solvent, followed by a final rinse with deionized water and then a volatile solvent like ethanol or acetone to promote rapid, spot-free drying. For stubborn organic residues, soaking in a dilute acid or specialized cleaning solution may be necessary, followed by thorough rinsing. Ultrasonic cleaners are generally not recommended as the vibrations can damage the fused joints of high-quality cuvettes.
- Orientation: Always insert the cuvette into the instrument’s holder in the same orientation for every measurement. A small mark on the top of the cuvette can aid in consistent placement, ensuring that minor imperfections in the cuvette walls do not introduce variability into the readings.
Conclusion: A Framework for Selecting the Right Instrument
The colorimeter and the spectrophotometer, while both instruments of light measurement, are designed for fundamentally different purposes, rooted in distinct scientific principles. The colorimeter acts as an electronic eye, providing a rapid, objective verdict on how a color is perceived under a single, specific condition. The spectrophotometer acts as a full-spectrum analytical tool, providing the detailed evidence—the spectral fingerprint—that allows for deep analysis, chemical quantification, and the prediction of color under any lighting condition.
Choosing the correct instrument is critical for generating meaningful data and avoiding costly errors. A prospective user should be guided by a logical framework based on their specific analytical needs:
- What is the primary analytical question? Is the goal to answer, “Does this sample’s color match the standard under our controlled factory lighting?” If so, a colorimeter may be sufficient. If the question is, “What is the concentration of this chemical?” or “What is the precise spectral composition of this sample?” then a spectrophotometer is required.
- Is metamerism a risk? If a product and its components are made from different materials or by different suppliers and must match visually in various environments (e.g., store, home, outdoors), then a spectrophotometer is essential. Using a colorimeter in this scenario introduces an unacceptable risk of illuminant metameric failure.
- Is color formulation required? To create new colors by mixing pigments or dyes, the full spectral data provided by a spectrophotometer is indispensable for accurate recipe prediction software. A colorimeter cannot be used for this task.
- What is the nature of the sample? While both instruments can measure simple liquids and flat surfaces, complex samples demand specialized tools. Materials with special effects, like metallic or pearlescent finishes, require a multi-angle spectrophotometer to be characterized properly. Analyses in the ultraviolet range, such as DNA quantification, mandate a UV-Vis spectrophotometer.
By carefully considering these questions, a user can move beyond a simple cost comparison and make an informed decision. The choice is not merely between a simple tool and a complex one, but between an instrument designed for routine control and one designed for comprehensive analysis. Selecting the right instrument ensures that the investment aligns with the complexity of the problem, providing the right data to maintain quality, drive innovation, and achieve accurate, reliable results.