To the user, a spectrophotometer can often seem like a black box: a sample goes in, and a number comes out. Yet, the remarkable precision of this fundamental laboratory instrument stems from the elegant and coordinated function of several key components. Understanding this internal architecture is crucial for appreciating the instrument’s capabilities, ensuring accurate results, and troubleshooting potential issues. This guide deconstructs the spectrophotometer, following the journey of light from its origin to the final data readout, then finally will tell you that how does a spectrophotometer work.
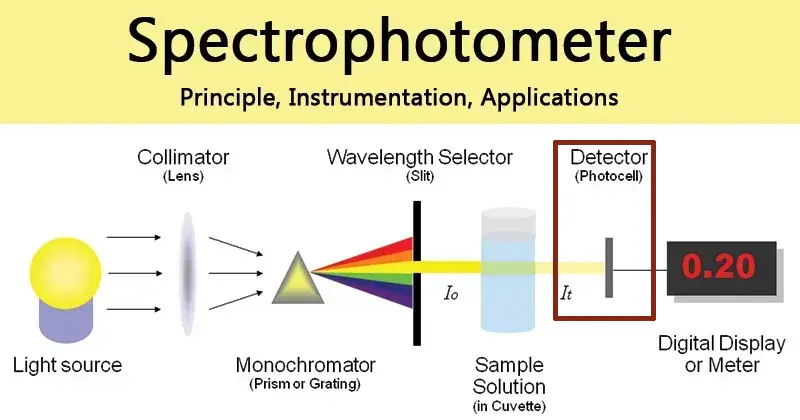
At its core, a spectrophotometer quantifies the concentration of a substance in a solution by measuring the amount of light it absorbs. The sequence of events follows a logical path: a lamp provides a light source, which is then separated into a specific wavelength. This monochromatic light passes through the sample, and a detector measures the intensity of the light that makes it through, converting this information into a digital display of transmittance or absorbance.
A Review of the Beer-Lambert Law: The Theoretical Foundation of All Measurements
The ability of UV-Vis spectrophotometry to perform accurate quantitative analysis is theoretically rooted in the Beer-Lambert Law. The mathematical expression of the law is:
A=ϵbc
Where:
- A is Absorbance (dimensionless)
- ε (epsilon) is the molar absorptivity, an intrinsic physical constant of a substance at a specific wavelength and in a specific solvent, with units of (L⋅mol⁻¹⋅cm⁻¹)
- b is the path length, the distance the light travels through the sample, typically determined by the width of the cuvette, with a standard of 1 cm.
- c is the molar concentration of the absorbing substance, with units of mol⋅L−1.
Absorbance A itself is calculated by measuring the incident light intensity (I0) and the transmitted light intensity (I), with the relationship being A=log10(I0/I). The physical significance of the Beer-Lambert Law is that it reveals a perfect linear positive correlation between a substance’s absorbance and the product of its concentration and path length under ideal conditions. This allows us to determine the concentration of an unknown sample by preparing a series of standard solutions of known concentrations, measuring their absorbance, and plotting a standard curve.
To learn more about applying the Beer-Lambert Law, click here.
A standard spectrophotometer consists of a light source, monochromator, sample compartment, and detector. Let me explain the role of each component in order:
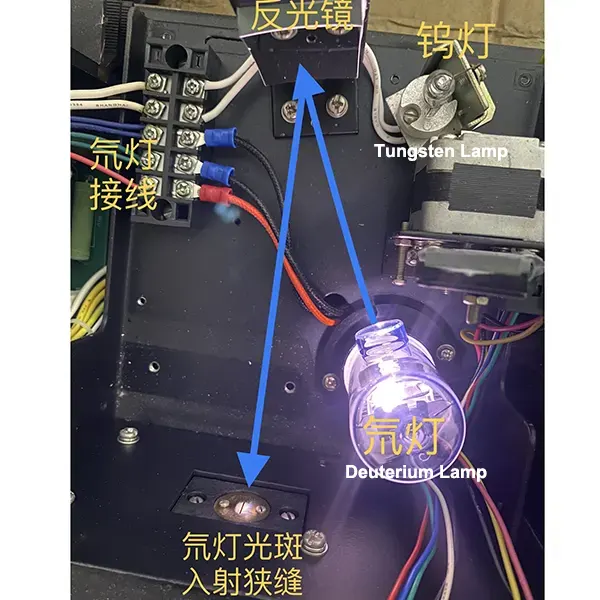
1. The Light Source: The Origin of the Analysis
 |
|
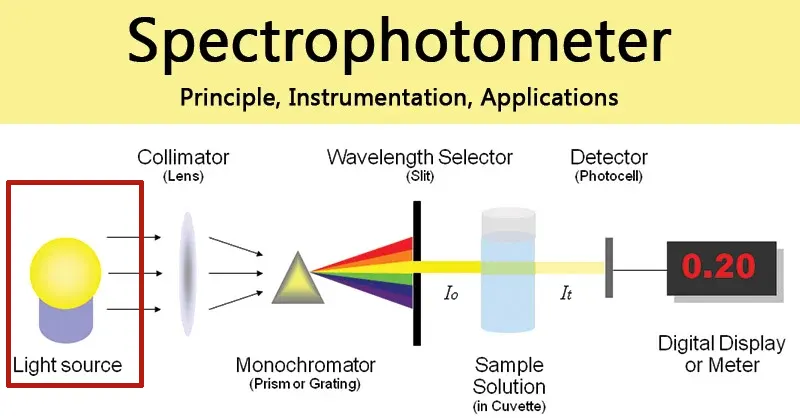
The entire process begins with a stable and reliable source of light. The ideal light source for spectrophotometry should be bright across a wide wavelength range, exhibit long-term stability, have a long service life, and be cost-effective. No single lamp perfectly meets all these criteria for the entire UV-Visible-NIR spectrum, which is why most instruments use a combination of sources.Halogen/Tungsten Lamp: This is the workhorse for the visible (VIS) and near-infrared (NIR) regions, typically covering wavelengths from 400 nm to 700 nm and beyond. Operating on a principle similar to a standard incandescent bulb, an electric current heats a tungsten filament until it glows. The inclusion of a halogen gas creates a regenerative cycle that returns evaporated tungsten to the filament, significantly extending the lamp’s life to around 2,000 hours and ensuring a bright, stable output.Deuterium Lamp: For analysis in the ultraviolet (UV) region (185 nm – 400 nm), a deuterium lamp is required. This is a gas-discharge lamp where an electric arc excites deuterium gas, causing it to emit a continuous spectrum in the UV range. Deuterium lamps also have sharp, intense emission lines at 486.0 nm and 656.1 nm, which are often used as built-in references for wavelength calibration.Xenon Flash Lamp: Some High-end Spectrophotometer utilize a xenon flash lamp, which has the advantage of covering both the UV and visible ranges. It emits light in powerful pulses, generating less heat and requiring no warm-up time. While this extends the lamp’s functional life, it requires more complex electronics to ensure pulse-to-pulse stability.
2. The Monochromator: Selecting the Precise Wavelength
|
|
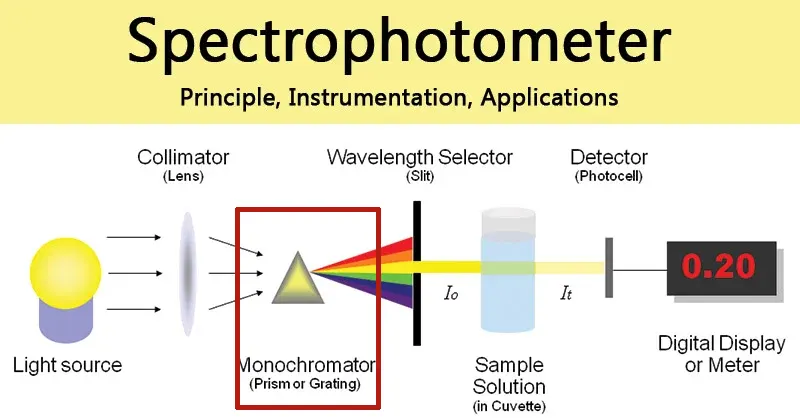
Light from the source is polychromatic, meaning it contains many different wavelengths. The function of the monochromator is to act as a highly precise filter, separating this light and allowing only a very narrow band of a specific wavelength to pass through to the sample.
Entrance Slit: A narrow opening that shapes the incoming light into a well-defined beam before it reaches the dispersive element.Dispersive Element (Diffraction Grating): In modern spectrophotometers, the diffraction grating has almost universally replaced the prism as the primary dispersive element. A diffraction grating is a reflective surface inscribed with thousands of microscopic, parallel grooves. When light strikes the grating, these grooves cause the light waves to diffract and interfere with each other, separating the light into its constituent wavelengths much like a prism creates a rainbow. By precisely rotating the grating, a specific wavelength can be directed toward the exit slit.Exit Slit: This second narrow opening is positioned to allow only the selected wavelength from the dispersed spectrum to pass through, blocking all other wavelengths. The physical width of the exit slit determines the spectral bandwidth—a key performance indicator of the instrument’s ability to resolve fine spectral details.
3. The Sample Compartment: Where Light Meets Matter
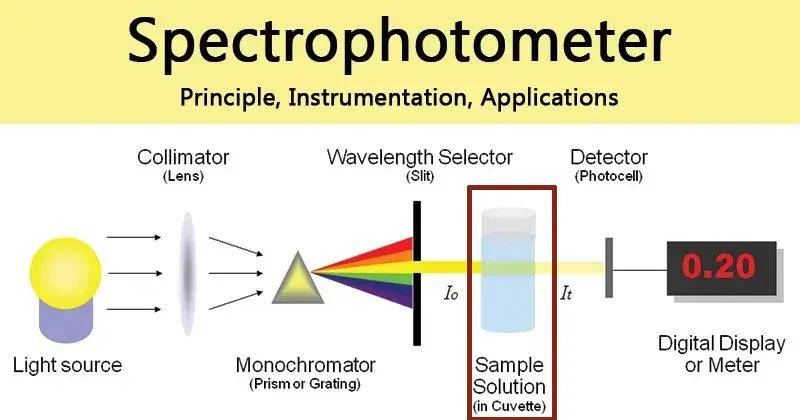 |
After the monochromator, the now-monochromatic light beam enters the sample compartment. This is where the critical interaction between light and the sample occurs. The compartment is designed to hold a cuvette—a small, transparent container for the liquid sample—securely in the light path.
The design of this compartment is a key differentiator between instrument types.
In a single-beam spectrophotometer, the compartment holds one cuvette at a time. A measurement requires first inserting a “blank” cuvette (containing just the solvent) to set a zero-absorbance reference, and then replacing it with the sample cuvette for the actual measurement.
In a double-beam spectrophotometer, the light is split into two parallel beams before entering the compartment, which has positions for both a reference cuvette and a sample cuvette. This allows for simultaneous measurement, providing real-time correction for any fluctuations in the lamp’s intensity.
4. The Detector: Translating Light into Data
 |
The detector is the final component in the optical path. Its job is to capture the photons that have successfully passed through the sample and convert their light energy into a measurable electrical signal. The strength of this signal is directly proportional to the intensity of the transmitted light.Photomultiplier Tube (PMT): Often found in high-grade instruments, the PMT is exceptionally sensitive, making it ideal for detecting the very low light levels that occur when measuring highly absorbent samples. It works via the photoelectric effect; when a photon strikes its photosensitive surface, an electron is ejected. This electron is then accelerated through a series of electrodes (dynodes), creating a cascading avalanche of secondary electrons that results in a massively amplified electrical signal.Silicon Photodiode: A more common and cost-effective detector used in many benchtop and portable instruments. These solid-state semiconductor devices generate a current that is proportional to the intensity of the light striking them. While less sensitive than PMTs, they are highly stable and provide excellent performance for most routine applications.Array Detectors (CCD/Photodiode Array): Used in high-speed spectrophotometers, these detectors consist of a linear array of many small photodiodes. Instead of scanning one wavelength at a time, the diffraction grating projects the entire spectrum onto the array, allowing all wavelengths to be measured simultaneously.
5. The Readout System: Displaying the Results
The final step is the conversion of the detector’s electrical signal into a comprehensible result. An electronic system, often involving a galvanometer or a digital processor, translates the signal into a display of Transmittance (the percentage of light that passed through the sample) or, more commonly, Absorbance (the logarithmic value of light absorbed by the sample). Modern instruments feature digital displays and sophisticated software that can plot full spectra, perform kinetic analyses, and automatically calculate sample concentrations based on the Beer-Lambert law.
By understanding this intricate journey, from the lamp’s first glow to the final digital readout, one can fully appreciate that the spectrophotometer is not a black box, but a masterpiece of optical and electronic engineering designed for one purpose: to precisely measure the interaction of light and matter.